|
Safety 1st Risk Model Performance
Important Information: Performance results do not include investment advisory fees of any kind (for example, an advisory fee of 1% compounded over a 10 year period would reduce a 10% return to an 8.9% annual return). The impact of taxes on results is not included. Dividends from a hypothetical investment in the S&P 500 Index are excluded in the analysis. To be conservative, interest earned by the Strategy when it is out of the market and in short-term fixed income securities is not included in the results. Performance results shown here have not been independently audited. Estimates for slippage and commissions are included. Investing in the S&P 500 Index, or any other index, is not possible and it is used here only as a proxy for the stock market in general. Unless otherwise stated, performance results for indicators, models and strategies are hypothetical, based on backtesting using historical data, and are not a reflection of actual investment results. Past performance, whether actual or indicated by historical tests, is no guarantee of future performance or success. The risks of substantial losses are inherently part of our investment strategies and our strategies may be more volatile than the benchmark indices used for comparison. Real-time investing results presented here may differ from the results that have been or will be achieved in actual client accounts depending on cash levels held, actual transaction costs incurred, advisory fees and taxes paid and other factors. Prospective clients should see “Important Disclosures & Backtesting Results Disclaimer” in the footer of schulercapital.com or contact us directly for more information.
The Path Is As Important As The Destination
All of us want to enjoy life. The whole reason to have money is to be able to spend our time the way we want. We remember major bear markets not only because they make us miserable with worry, but also because they often scare us into doing the exact wrong thing at the exact wrong time. A recent study shows that the pain caused by losing money is double the pleasure from making money. Our focus on risk management first – don’t lose money – is designed to avoid the crushing drawdowns and swings in wealth that our clients might experience on the way to achieving their investment goals. The desire to manage risk was the motivation behind the development of our Safeguard 1st Risk Model. What is a Risk Model? A risk model is the combination of a number of reliable, objective indicators based on historical data used to assess the level of risk* in the market. The Safeguard 1st Risk Model is a composite of seven indicators: four are breadth indicators, one is a trend indicator, and two are monetary indicators. More about how our indicators and how they were developed can be found here. *Risk can be thought of as the likelihood that you will lose a lot of money. For a more in-depth explanation of risk click here. How Was the Safeguard 1st Risk Model Created? The Safeguard 1st Risk Model is created from the sum of the signals and scores for each of the seven indicators. The selection and weightings for the indicators were determined through a process called backtesting to validate the Risk Model's effectiveness in determining the most risky and least risky times to be in the market. The process for doing this is the same as for developing indicators and a detailed explanation can be found here. How It Works Take a look at the chart below. The top half is a chart of the S&P 500 Index, our proxy for the stock market. In the bottom half of the chart, the green line is the final sum of the scores of our seven indicators added together: our Safeguard 1st Risk Model results. The horizontal lines are thresholds that generate buy and sell signals when the green line crosses above or below them. Buy and sell arrows mark the risk model's signals in the top chart. Note: More information about our charts and tables can be found at Using Our Charts/Tables. Details about the backtesting we performed can be found at Backtesting Methodology & Results. Definitions for many technical terms can be found in Definitions. Click on charts/tables to enlarge. 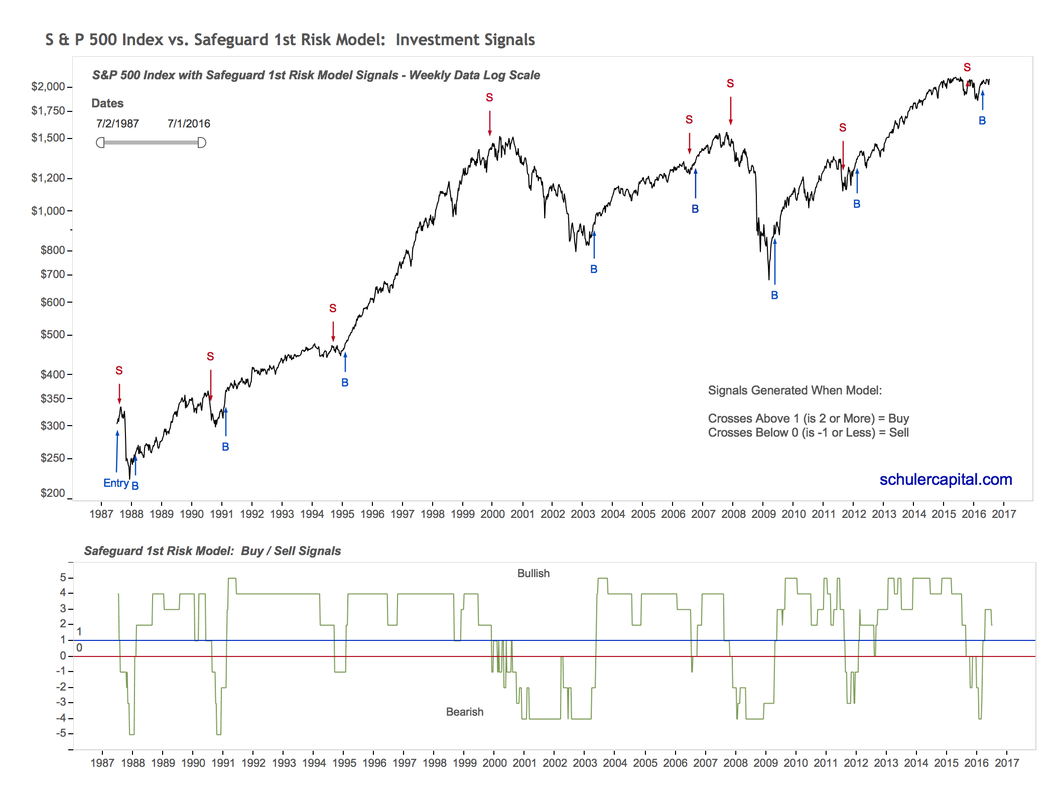
Buy signals are generated when the Safeguard 1st Risk Model’s score crosses above 1 (becomes a 2) and sell signals are generated when its score crosses below 0 (becomes a -1). Notice that we do not get signals very often, but when we do, very few have been false signals and the timing has been excellent for identifying risky times to be in the market. We rely on the Safeguard 1st signals to determine when we are in the market and when we are out of the market. Historical Performance: Backtest Results
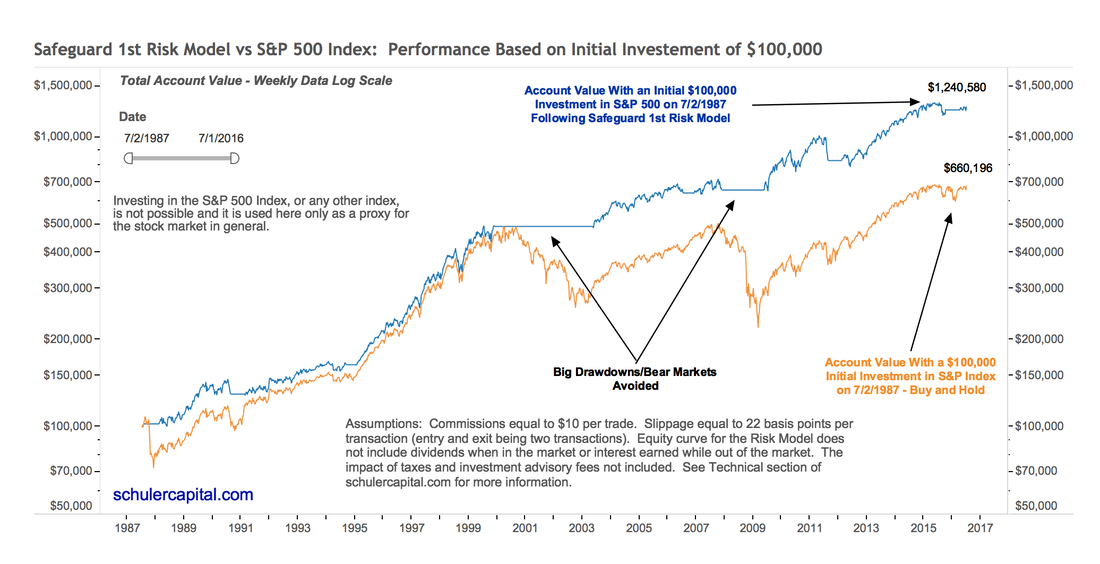
The Equity Curve graph below shows what the total account value would have been on 7/1/2016 if a $100,000 initial investment had been made on 7/2/1987 – 29 years earlier following the Safeguard 1st Risk Model signals compared with a Buy & Hold strategy. |
|
|
The Equity Curve chart illustrates two things:
|
|
|
|
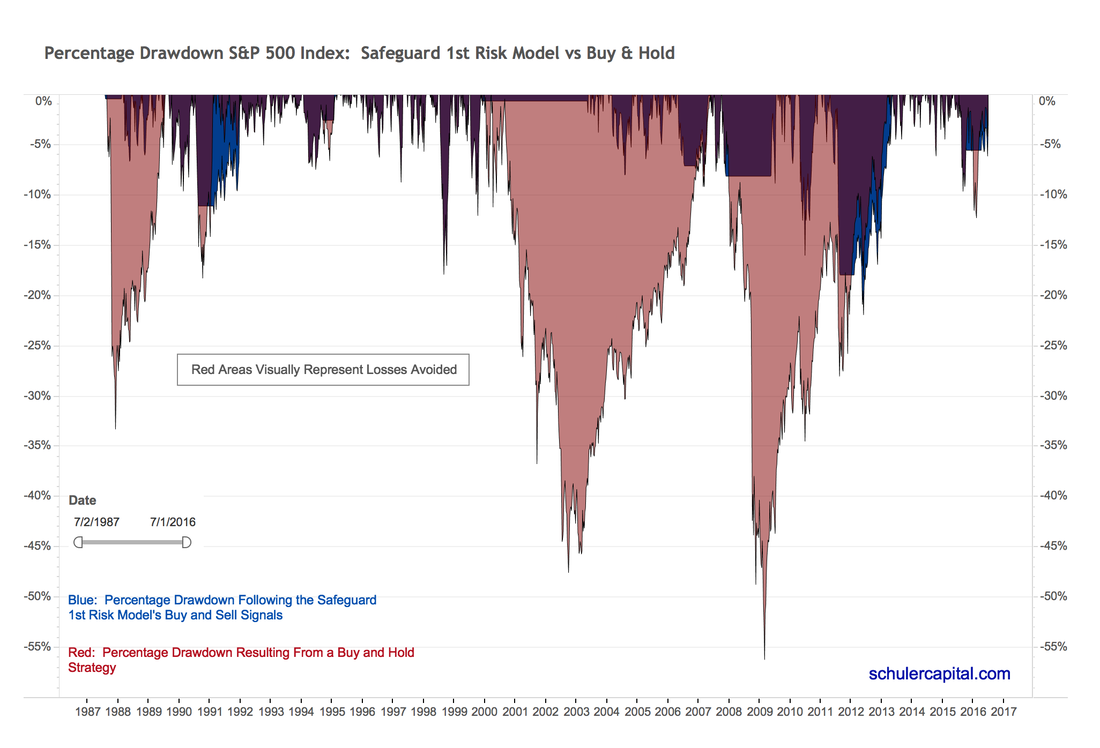
Percent drawdown is defined as the total loss in percentage terms from the previous, all-time high in the account. A more detailed explanation of drawdown can be found here. The red in the chart below represents the losses an investor would have experienced from the previous high if s/he had invested in the S&P 500 Index and implemented a Buy & Hold strategy for 29 years. The blue in the chart shows the losses the same investor would have experienced from the previous high had s/he followed the Safeguard 1st Risk Model buy and sell signals.
|
|
|
The value of the Safeguard 1st Risk Model is illustrated here vividly. For Buy & Hold, the maximum drawdown percentage occurred in March of 2009, at 56.24%. But look at what the Safeguard 1st did. It signaled to get out of the market on 11/30/2007 and to get back into the market on 5/22/2009. The total drawdown for the 2008-2009 Great Financial Crisis would have been limited to 8.15%! In fact, the Drawdown Chart graphically shows that, based on historical data for the entire 29-year history, the Safeguard 1st Risk Model would have reduced an investor's losses significantly during the 29-year period. (Remember past performance is not a guarantee of future results. See Important Information above). |
|
|
|
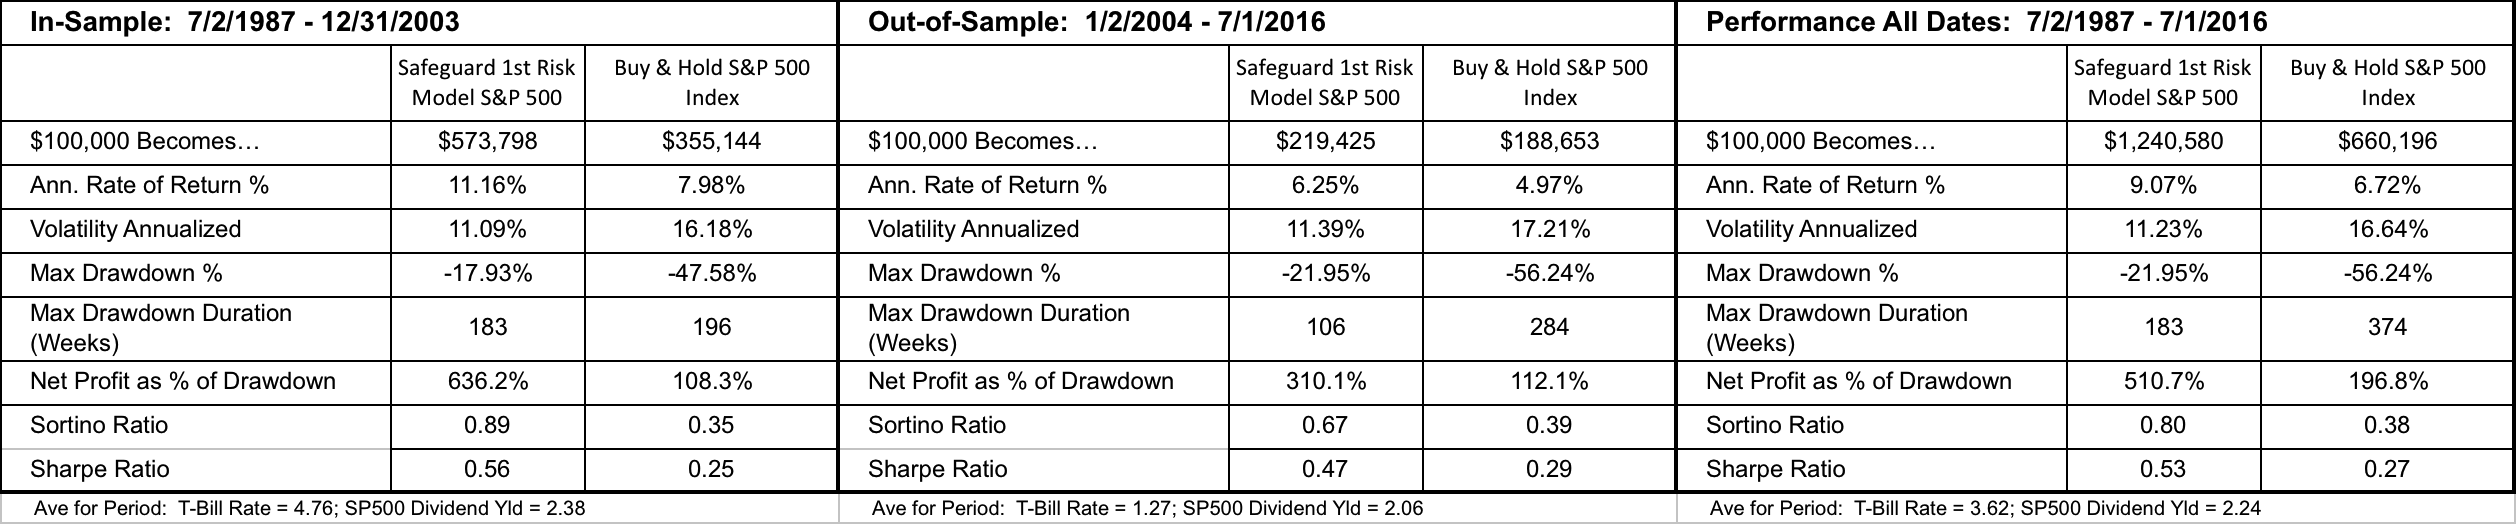
The Performance Table below summarizes the results of the backtest we performed to develop the Safeguard 1st Risk Model. It is the format we use to summarize the backtesting we performed for all of our indicators, our Safeguard 1st Risk Model and our Strategies. Backtesting is simply the process of dividing your historical data into two parts: in-sample and out-of-sample. Indicators/models/strategies are developed and refined on the in-sample data and tested on the out-of-sample data, which simulates actual trading. The testing on the out-of-sample data simulates actual investing with real money. The All Dates section of the Performance Table combines the results for both in-sample and out-of-sample periods.
You can find out more information on backtesting and how we developed the Indicators and the Safeguard 1st Risk Model in the Indicators Section of this website. Click for a better image. |
|
|
A quick summary of the Performance Table for the Safeguard 1st Risk Model: Return Measure Results
Risk Measure Results
We have covered the Safeguard 1st Risk Model in significant detail because all of our strategies use it as their foundation. In fact, our Safeguard 1st Strategy is based entirely on the Safeguard 1st Risk Model. |