Schuler Capital Management LLC
  • Approach
    • What Makes Us Different
    • How We Work With Clients
    • About Us
  • Risk Model
    • Safeguard 1st Risk Model
    • Why Does It Work?
    • Risk Management vs Market Timing
    • Key Takeaways
    • What Is Safeguard 1st Telling Us Now? >
      • Current Safeguard 1st Signals
  • Strategies
    • Safeguard 1st Strategy
    • Large Cap Momentum Strategy
    • Small Cap Momentum Strategy
    • Custom Strategies
  • Reasons Why
    • Buy & Hold May Not Always Be Best
    • The Achilles Heel of the 60/40 Portfolio
    • Is Your Portfolio Really Diversified?
    • Gradually Shifting Asset Allocations Doesn't Effectively Manage Risk
    • Cash Is Not Trash
    • Fees Matter
    • What To Know About Track Records
  • Technical
    • Backtesting Methodology & Results >
      • Backtesting Description
      • Indicators & Risk Model: Description & Development
      • Safeguard 1st - Backtest Results
      • Large Cap Mo - Backtest Results
      • Small Cap Mo - Backtest Results
      • Dividend & Interest Assumptions
      • Transaction Cost Assumptions
    • Data Facts
    • Definitions >
      • Alpha
      • Beta
      • Black Swan
      • Correlation
      • Drawdown
      • Efficient Mkt Hypothesis
      • Market Timing
      • Profit Factor
      • Risk
    • More...Definitions >
      • Risk Measures >
        • Sharpe Ratio
        • Sortino Ratio
        • Standard Deviation
        • Volatility
      • R-Squared
    • Diversifying Company Risk
    • Momentum
    • Stop Loss Dangers
    • Tax Considerations
    • Timing of Signals/Trades
    • Using Our Charts/Tables
Risk Management versus Market Timing
 
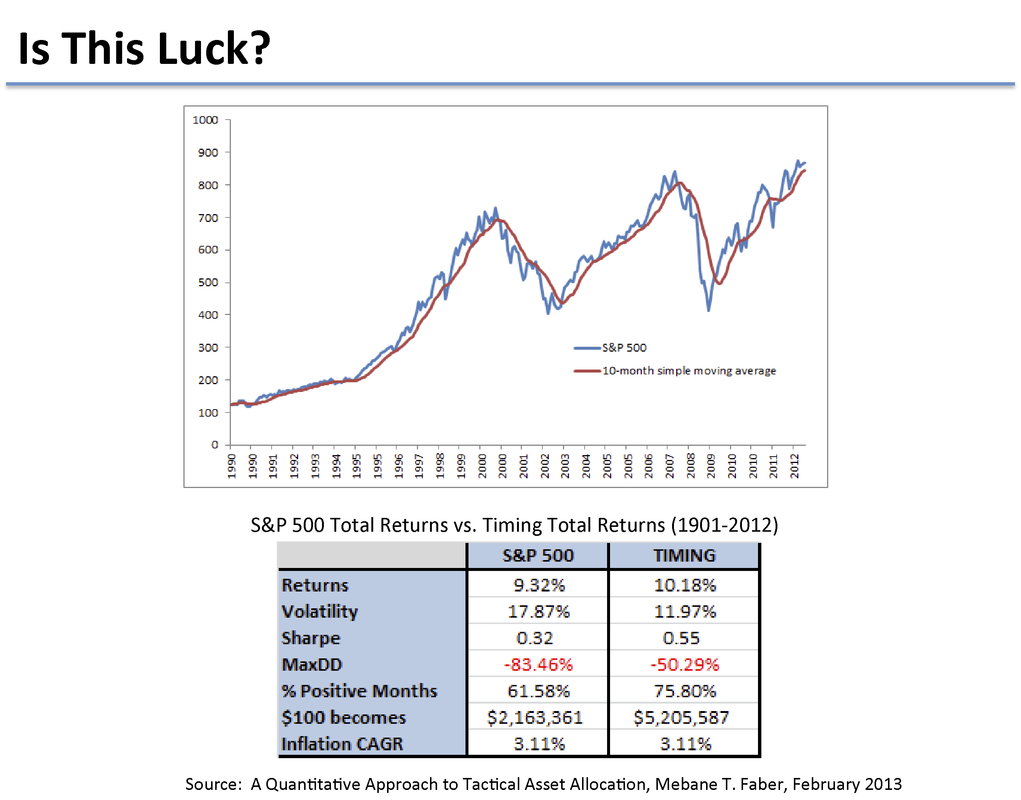
Some would say, “Well, isn’t this just  market timing , which we all know cannot be done?”  We have two responses. 

First, we don’t consider it market timing, because market-timing systems are usually oriented to maximize profits – in other words, they try to pick the highs and lows.  Our objective is different.  We are trying to minimize losses:  we don’t want to lose money.  That is a completely different objective.  (In fact, we optimized our indicators on Profit Factor, which is the greatest profit for the given loss the strategy produces).  
 
Our goal is to get out of the market when conditions match the riskiest times to be in the market based on the past, and to get back into the market when conditions match the best times to be in the market based on the past.  If we get out 10% below the top and, the market declines further, then recovers and we get back in at a higher price than when we sold, our goal has been achieved:  we haven’t lost money, even though we have underperformed the market for a time.  In short, we reduce overall risk by avoiding portfolio-crushing bear markets.  Ours is not a market-timing strategy.  It is a risk-management strategy.
 
Second, we do not dismiss the idea that market timing is possible.  The reason so many think it is not is because they are measuring returns only and not risk-adjusted returns.  Market timing, designed correctly produces similar returns as Buy & Hold, but with lower volatility and drawdowns.
 
In Mebane Faber’s paper, “A Quantitative Approach to Tactical Asset Allocation,” he proposed a very simple trend-following strategy using the 10-month moving average.  When the S&P500 crossed above the moving average, fully invest and when it crossed below, sell everything.  Are the results in the chart below an accident or is market timing possible?
Picture

The following quote gives Faber’s answer:
“I firmly believe timing the market is not only possible, it isn’t that difficult.  It is really quite simple and is based on common sense…our market timing approaches work by reducing volatility and drawdowns.  This is one reason many think that market timing isn’t possible – all they do is focus on returns when basic market timing works by not doing really dumb things, such as buying into bubbles.”
Disclosures & Backtesting Results Disclaimer
Contact
Legal
Privacy Policy
Internet Communications Notice