|
Buy & Hold Is Not Always Best
What Is Buy & Hold With few exceptions, the financial community practices “Buy & Hold” investing. Buy & Hold investing is based on the belief that while the market will go up and down in the short term, over the long term it will rise at a relatively predictable rate. So in periods of economic upheaval, investors are told to be patient, wait out the storm, not panic and rearrange their portfolios. Confidence in an ever-rising market forms the foundation of the mainstream approach to portfolio construction. Investors are taught to decide how much risk they’re willing to take — greater risk offers higher potential returns, but also an increased chance of losing money if things go wrong. The idea is that once investors settle on the level of risk they’re comfortable with and what time frame they have, they’ll then know how best to divide up their investments. The most traditional recommended allocation for a portfolio would be hold 60 percent stocks and 40 percent bonds. As an investor aged, the recommendation would shift. For example, if they need begin withdrawing their money soon and would rather have lower, but more reliable returns, they might go with a conservative portfolio made up of 60% bonds and only 40% stocks. |
|
|
According to Buy & Hold investing, each time frame and level of risk has its own ideal asset ratio. And because Buy & Holders believe the market grows at reliable, historical rates, investors can depend on receiving the returns they were promised when they first created their portfolios. Unfortunately, things haven’t always worked out that way.
In this section, we look at the performance of a Buy & Hold strategy on the equity portion of a portfolio only. We address how a 60/40 stocks-to-bonds portfolio performs in The Achilles Heel Of The 60/40 Portfolio. Further, we explain why it is increasingly difficult to achieve a diversified portfolio in Is Your Portfolio Really Diversified?. But first, stocks only… Buy & Hold Done Correctly Is Hard To Beat If You Only Look At Returns… We readily admit that Buy & Hold is hard to beat for most investors. Its success can be attributed mainly to the discipline it imposes on the investor, preventing him/her from panic selling during bear markets. The rise of low-cost, tax-advantaged index ETFs allows investors to come very close to matching the performance of the underlying indices, like the S&P 500 or the Dow Jones Industrial Average. More and more investors are aware of the advantages of passive investing via index ETFs and money is shifting out of active investments like mutual funds and individual stocks and into ETFs. Mutual funds are not tax-advantaged and frequently distribute capital gains to their holders. Given the fact that mutual funds as a whole have an average turnover of 117% and a median turnover of 65%*, the opportunity for pre-tax compounding of returns with mutual funds almost disappears. The S&P 500 Index has a turnover of 4-5% per year, which means even index mutual funds create tax liability for their investors. When the tax liability of mutual funds is combined with typical fees of 0.5 – 1.0 percent, beating the market becomes difficult. *Investment Company Institute, Mutual Fund and Portfolio Turnover, November 17, 2004 …But There Is More To It Than Just Returns Buy & Hold has two fundamental flaws:
Let’s assume that a typical investor decides that a Buy & Hold strategy is best for him and he makes the smart decision to pick a low-cost, tax-advantaged S&P 500 index ETF. What will his/her risk to return profile look like? 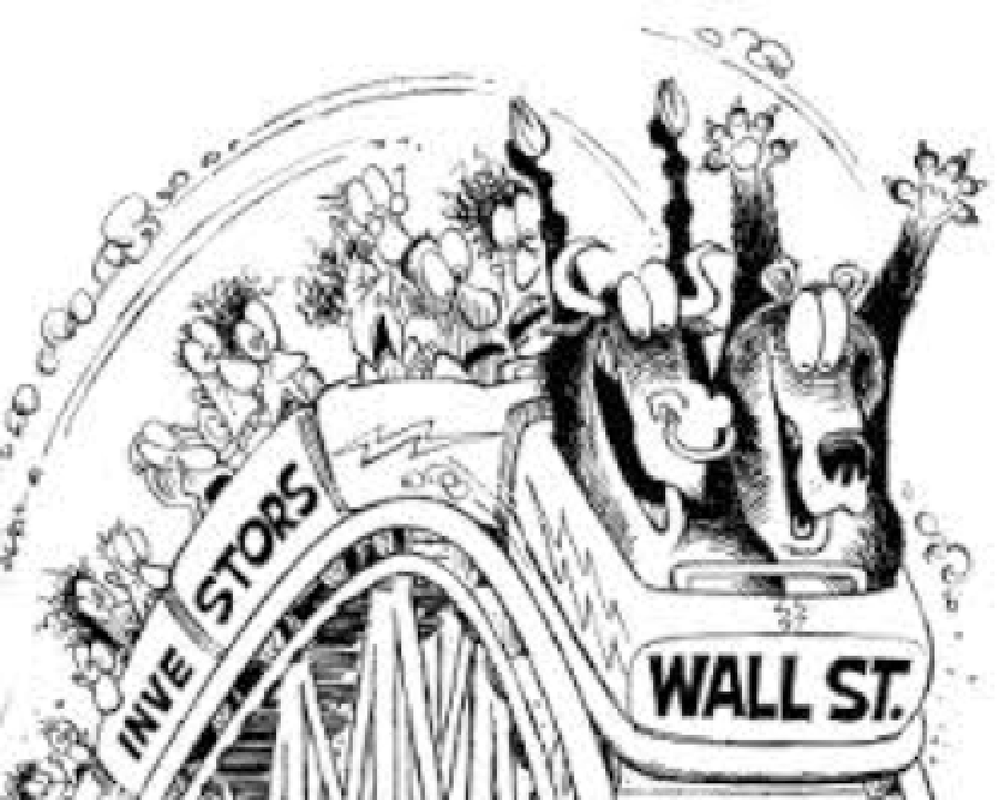
|
|
Virtually every bear market except one (1956) has re-possessed or taken back roughly one-half or more of the previous bull market’s gain. Today, that would equate to 9,400 DJIA points! Are you willing to endure this roller coaster ride? (Source: Investech.com) 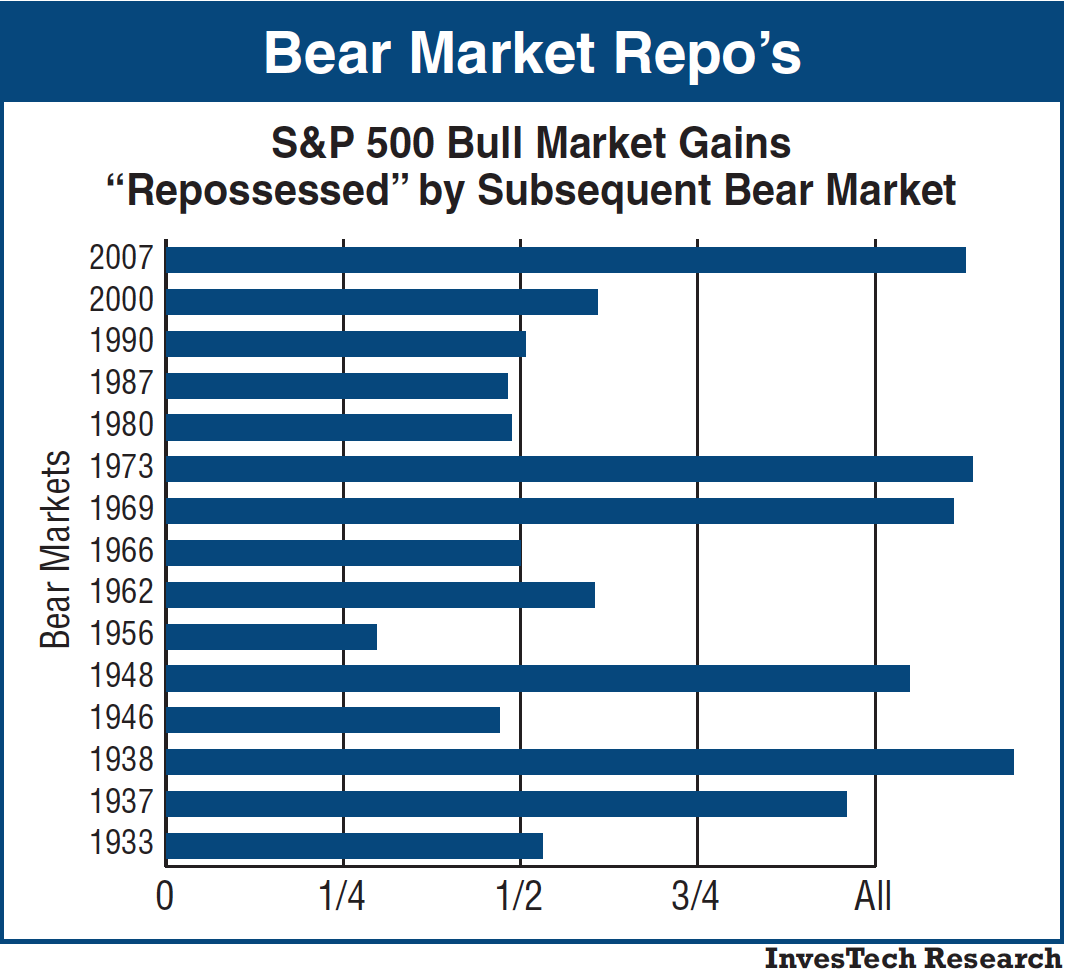
Buy & Hold as a strategy does not have any risk management. Buy & Hold investors have endured major declines in their account value every 10 to 20 years. The chart below shows the maximum drawdown an investor would have experienced being 100% invested in the S&P 500. (Click here for explanation of maximum drawdown). Are You Prepared for Losses of 50 to 80 Percent? 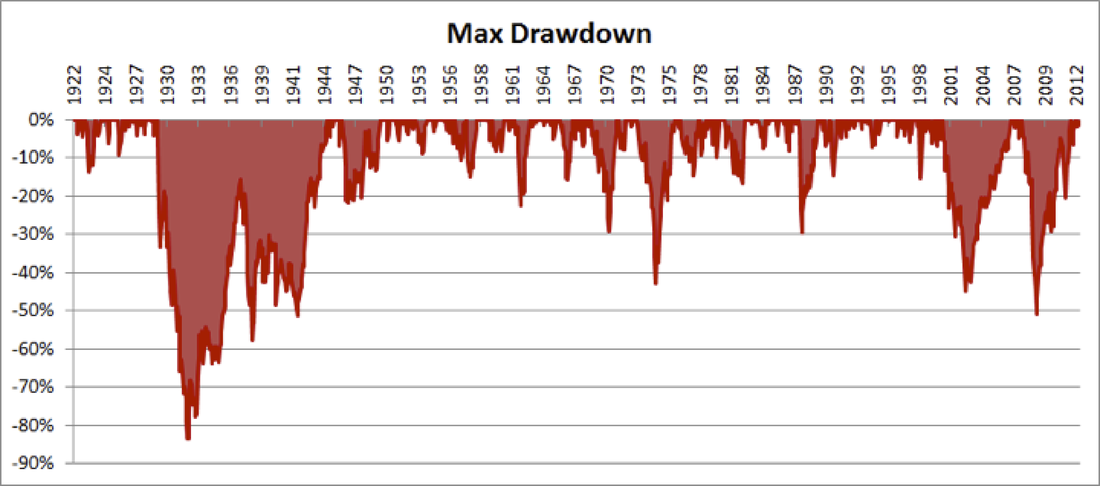
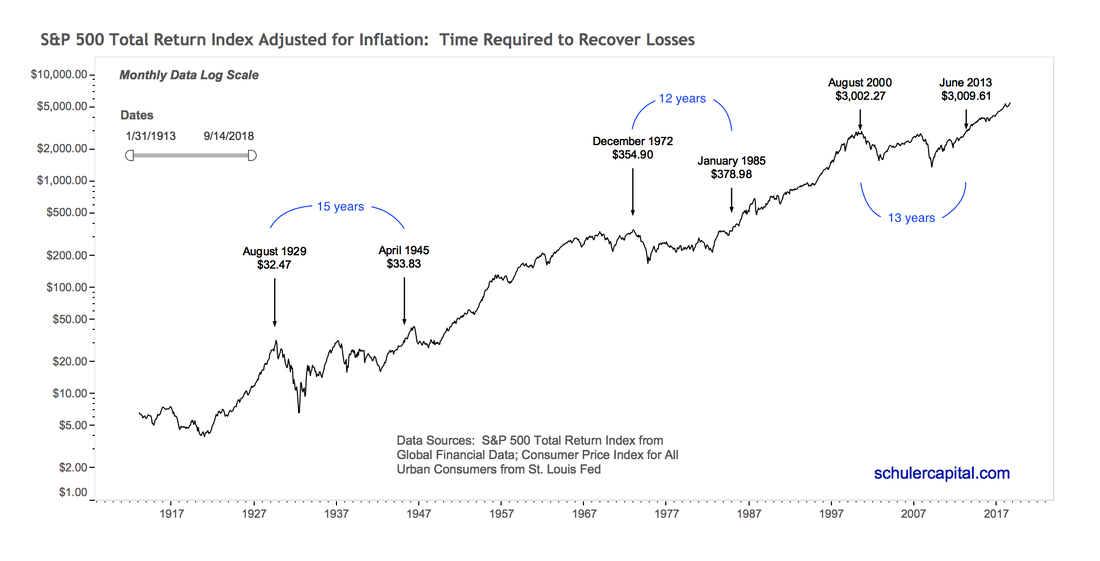
But major losses/drawdowns have not been the worst aspect of the Buy & Hold strategy. What happens if one of these bear market events occurs at the same time you need to take money out of your account for retirement or an emergency? How will you feel if your account is down to one-half of what it once was? In fact, behavioral finance studies have shown that the psychological pain investors feel from a loss is twice as strong as the joy they receive from a similar size gain.* *Source: Kahneman, D. and Tversky, A. (1984). “Choices, Values, and Frames”. American Psychologist 39, pages 341-350 Consider the following:
The chart of the S&P 500 Index with dividends reinvested and adjusted for inflation demonstrates that Buy & Hold investors have suffered from prolonged periods of negative real returns in the past. |
|
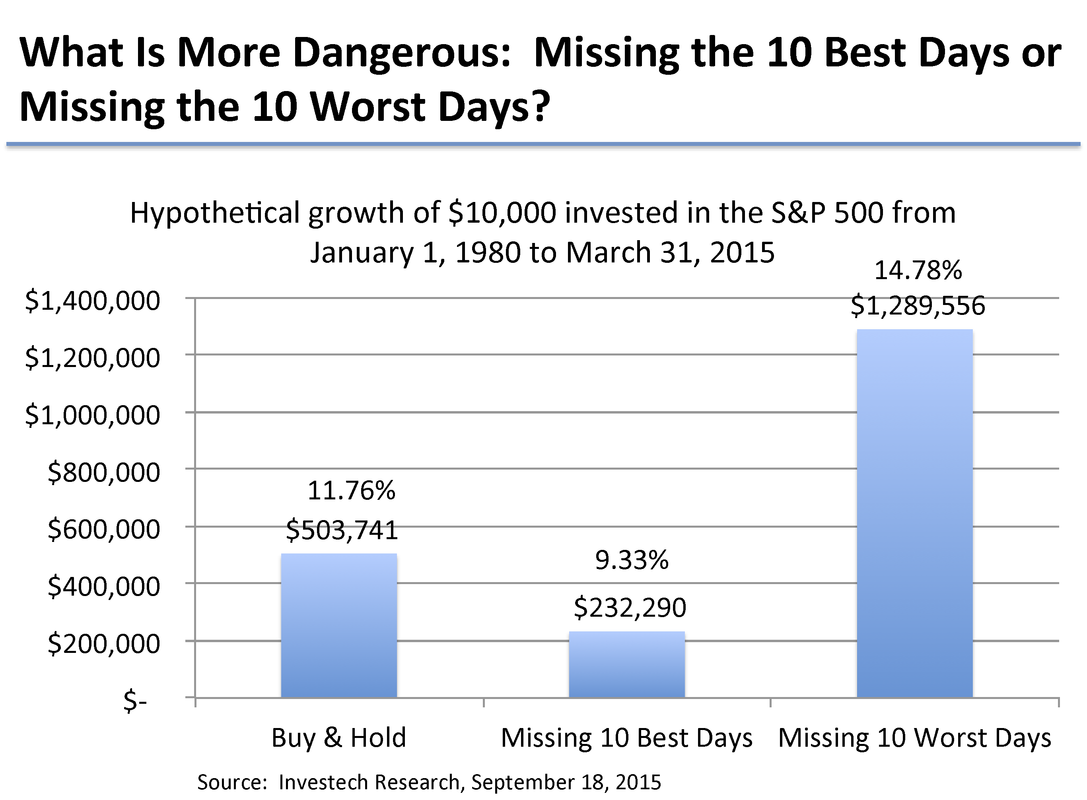
The Old Argument “But Look What Happens If You Miss The 10 Best Days” Buy & Hold advocates often compare historical returns for Buy & Hold with the returns gained if and investor had been out of the market on the 10 days that had the highest percentage gains. But look what happened if instead of missing the 10 best days, s/he had missed the 10 worst days. |
|
But Don’t Taxes (for Taxable Accounts Only!) And Transaction Costs Make Active Management Unviable Compared to Buy & Hold? Sometimes. Unfortunately, many technicians/financial professionals do not always provide information on the impact of taxes and transaction costs in their models or their investment results. We have made an effort to quantify the impacts of both in our comparisons between our strategies and Buy & Hold. Transaction costs, including commissions and slippage were estimated and built into all of our models. Our stated return rates include estimated transaction costs. We estimated the potential impact of taxes in separate calculations apart from our models, indicators and strategies. We estimated the impact of taxes on our annualized return rates by determining the percentage of transactions subject to short-term and long-term capital gains and then assumed our investors would be subject to the highest tax brackets (highest Federal bracket, including the Obamacare capital gains investment tax and the highest California tax bracket). To determine the incremental taxes paid between our strategies and a Buy & Hold strategy, we assumed that the Buy & Hold investor would have to sell her/his holdings at the end of 25 years. Please see the Tax Considerations section for detail on the assumptions and calculations made. WARNING: We do not have expertise in tax matters and we are not qualified to give tax advice. All viewers of this information, including prospective and existing clients should use it as a starting point for consultations with their professional tax advisor. Please see Disclosures & Backtesting Results Disclaimer. Taxes paid are highly dependent on your individual circumstances and you should rely on a professional for advice. A rough after-tax comparison, given our stated assumptions, of our stategies' returns compared to Buy & Hold returns can be made by subtracting the percentage amounts below from the corresponding annualized returns of each of our strategies (see Strategies section of this website) to make a rough, apples-to-apples comparison with a Buy & Hold strategy. Our Unqualified Estimate of the Reduction of the Annualized Return % Due to Taxes vs Buy & Hold By Strategy (subtract the percentage for each strategy from the annualized returns for each strategy to get our estimate of the after-tax returns for each strategy):
Summary on Taxes Based on historical data and our assumptions for, and estimates of, the impact of taxes, all of our strategies had returns that exceeded their benchmarks by more that the tax impact shown above, and in the case of the momentum strategies, by significantly more; however, please remember, past performance is not a guarantee of future results and again, you should consult with your tax professional when evaluating any and all tax implications. PLEASE NOTE: For tax-deferred accounts, like traditional IRAs or SEPs or tax-free accounts, like Roth IRAs, the tax implications associated with our strategies are by and large not different than with a Buy & Hold strategy. The analysis above only applies to taxable accounts!
Key Takeaways Buy & Hold as a strategy is simply a construct based on a mental backtest using the last 100 years of U.S. stock market history without any weight given to risk or risk management: in other words, it assumes that markets will perform as they have for the past 100 years. Often, those who doubt the validity of backtesting, have faith in Buy & Hold, not realizing that their justification is based on what has historically happened in markets and is just an unsophisticated backtest! If you are able to endure the rocky path of significant ups and downs, stick to index ETFs, not make any withdrawals during downturns and the U.S. economy continues to grow as it has in the past, Buy & Hold may be okay for you. But we think our risk-managed strategies, in combination with your other portfolio investments, may provide you with the opportunity, based on historical data, to enhance your risk-adjusted returns and provide real diversification to moderate the swings in the total value of your investments. Past performance is not a guarantee of future results. Please seen Disclosures & Backtesting Results Disclaimer in the footer of this website. |