Schuler Capital Management LLC
  • Home
  • Approach
    • What Makes Us Different
    • How We Work With Clients
    • About Us
  • Risk Model
    • Safeguard 1st Risk Model
    • Why Does It Work?
    • Risk Management vs Market Timing
    • Key Takeaways
    • What Is Safeguard 1st Telling Us Now? >
      • Current Safeguard 1st Signals
  • Reasons Why
    • Buy & Hold May Not Always Be Best
    • The Achilles Heel of the 60/40 Portfolio
    • Is Your Portfolio Really Diversified?
    • Cash Is Not Trash
    • Fees Matter
    • What To Know About Track Records
​Tax Considerations
 
 
WARNING:  We do not have expertise in tax matters and we are not qualified to give tax advise.  All viewers of this information, including prospective and existing clients should use it as a starting point for consultations with their professional tax advisor.  Please see Disclosures & Backtesting Results Disclaimer.
 
 
For tax-deferred accounts, like traditional IRAs or SEPs or tax-free accounts, like Roth IRAs, the analysis in this section is not relevant!  This only applies to taxable accounts.


Why Taxes Are Important
 
Assuming assets generally appreciate, taxes become important in that the amount paid reduces the opportunity to compound returns.  As an example, compare two investors.  Investor A holds an investment over a long period, say 30 years, and is not required to pay taxes until he sells.  Another, Investor B, invests in similar assets and over the 30 year period sells at the end of each year and buys new, similar assets.  Investor B will need to pay capital gains taxes, each year, while Investor A won’t.  
 
Investor A has the advantage because he is able to compound returns on his tax liability.  (However, at the end of the 30 year period, Investor A has a tax liability and when he sells, he will need to pay taxes on his gains). 
 
 
Methodology For Assessing The Impact Of Taxes On Our Strategies Versus Buy & Hold
 
The basic methodology we used was to quantify how much more our strategies would need to return on an after-tax basis to equal the returns of a typical Buy & Hold strategy.  While we believe our analysis is useful, taxes paid are highly dependent on your individual circumstances and you should rely on a professional for advice.
 
Key Assumptions:
 
Conceptually, in order to compare our various strategies with a Buy & Hold strategy, needed to make a number of important, simplifying assumptions regarding the tax timing, mix of short-term and long-term gains, and treatment of dividends.  These assumptions were slightly different for each strategy:
 
Safeguard 1st Strategy vs. Buy & Hold Strategy Assumptions:

  1. Both the Safeguard 1st Strategy and the Buy & Hold Strategy trade the market (S&P 500 Index via the SPY ETF).
  2. The Buy & Hold investor receives the average market return of 7.05% not including dividends (for the period 7/1/1987 - 7/2/2016:   S&P 500 Total Return is 9.29%, less 2.24% in dividends = 7.05%).
  3. The investor in the Safeguard 1st Strategy liquidates his portfolio at the end of every four years (average time period between sell signals generated by the Safeguard 1st Risk Model), recognizes all of his gains as short-term or long-term gains according to the mix calculated by our database:
    1. For the Safeguard 1st Strategy during the period 7/2/1987 through 7/1/2016, LT gains were 87.5% of trades and ST gains were 12.5% of trades.
  4. The Buy & Hold investor holds his/her positions for 25, 30 or 35 years (we provide results for each of these cases).
  5. Dividends are excluded from the analysis, since they are treated equally by the tax code for both the Safeguard 1st Strategy and the Buy & Hold strategy.
    1. Since both strategies are investing in the same thing (SPY), the dividends paid would be the same for both while the Safeguard 1st Strategy is in the market.
    2. When the Safeguard 1st Strategy is out of the market, it would be earning interest on Treasury Bills.  We assume on an after-tax basis this interest earned is approximately  equivalent to the dividends earned by the Buy & Hold Strategy.  Two reasons support this:
      1. Interest on T-Bills earned by the Safeguard 1st Strategy is not taxable on a state and local basis, but is taxed at the higher ordinary income at the Federal level.
      2. The dividends earned by the Buy & Hold Strategy qualified for lower long-term capital gains tax rates at the Federal level, but are subject to state and local taxes.
      3. For these reasons, we assume net, net it is a wash.
 

 Large Cap Momentum Strategy vs. Buy & Hold Strategy Assumptions:

  1. The Buy & Hold Strategy trade the market (S&P 500 Index via the SPY ETF).
  2. The Buy & Hold investor receives the average market return of 7.05% not including dividends (for the period 7/1/1987 - 7/2/2016:   S&P 500 Total Return is 9.29%, less 2.24% in dividends = 7.05%).
  3. The investor in the Large Cap Momentum Strategy liquidates his portfolio before the end of each year, recognizes all of his gains as short-term or long-term gains according to the mix calculated by our database:
    1. For the Large Cap Momentum Strategy during the period 7/2/1987 through 7/1/2016, LT gains were 42.37% of trades and ST gains were 57.63% of trades.
  4. The Buy & Hold investor holds his/her positions for 25, 30 or 35 years (we provide results for each of these cases).
  5. Dividends are excluded from the analysis, since they are treated equally by the tax code for both the Large Cap Momentum and the Buy & Hold strategy.
    1. We assume dividends paid to the Large Cap Momentum Strategy on average would be approximately the same as dividends paid to to the S&P 500 Index (SPY) while the strategy is in the market. 
    2. When the Large Cap Momentum Strategy is out of the market, it would be earning interest on Treasury Bills.  We assume on an after-tax basis this interest earned is approximately  equivalent to the dividends earned by the Buy & Hold Strategy.  Two reasons support this:
      1. Interest on T-Bills earned by the Large Cap Momentum Strategy is not taxable on a state and local basis, but is taxed at the higher ordinary income at the Federal level.
      2. The dividends earned by the Buy & Hold Strategy qualified for lower long-term capital gains tax rates at the Federal level, but are subject to state and local taxes.
      3. For these reasons, we assume net, net it is a wash.

Small Cap Momentum Strategy vs. Buy & Hold Strategy Assumptions:

  1. The Buy & Hold Strategy trade the market (S&P 500 Index via the SPY ETF).
  2. The Buy & Hold investor receives the average market return of 7.05% not including dividends (for the period 7/1/1987 - 7/2/2016:   S&P 500 Total Return is 9.29%, less 2.24% in dividends = 7.05%).
  3. The Buy & Hold investor receives an average dividend yield of 2.24% (the average yield for the 29 year period above).  Dividends are assumed to be qualified and taxable at the LT capital gain tax rate.
  4. The investor in the Small Cap Momentum Strategy receives no dividends while in the market and no interest on cash when out of the market:  the most conservative, simplest case.
  5. The investor in the Small Cap Momentum Strategy liquidates his portfolio before the end of each year, recognizes all of his gains as short-term or long-term gains according to the mix calculated by our database:
    1. For the Small Cap Momentum Strategy during the period 7/2/1987 through 7/1/2016, LT gains were 36.66% of trades and ST gains were 63.34% of trades.
  6. The Buy & Hold investor holds his/her positions for 25, 30 or 35 years (we provide results for each of these cases).
  7. The total return for Buy & Hold is the average market return excluding dividends of 7.05%, plus the average dividend yield of 2.24% less the long-term capital gains taxes paid each year on the dividends received (13.3% for state & local  and 23.8% for Federal (see Tax Rate Assumptions below).
  8. The total return for the Buy & Hold Strategy is assumed to be 7.05% plus a 1.41% after-tax dividend yield or 8.46%.


High Turn Momentum Strategy vs. Buy & Hold Strategy Assumptions:

  1. The Buy & Hold Strategy trade the market (S&P 500 Index via the SPY ETF).
  2. The Buy & Hold investor receives the average market return of 7.05% not including dividends (for the period 7/1/1987 - 7/2/2016:   S&P 500 Total Return is 9.29%, less 2.24% in dividends = 7.05%).
  3. The Buy & Hold investor receives an average dividend yield of 2.24% (the average yield for the 29 year period above).  Dividends are assumed to be qualified and taxable at the LT capital gain tax rate.
  4. The investor in the High Turn Momentum Strategy receives no dividends while in the market and no interest on cash when out of the market:  the most conservative, simplest case.
  5. All of the gains in the High Turn Momentum Strategy are taxed at short-term capital gains rates (ordinary income)​
  6. The Buy & Hold investor holds his/her positions for 25, 30 or 35 years (we provide results for each of these cases).
  7. The total return for Buy & Hold is the average market return excluding dividends of 7.05%, plus the average dividend yield of 2.24% less the long-term capital gains taxes paid each year on the dividends received (13.3% for state & local  and 23.8% for Federal (see Tax Rate Assumptions below).
  8. The total return for the Buy & Hold Strategy is assumed to be 7.05% plus a 1.41% after-tax dividend yield or 8.46%.


 Tax Rate Assumptions:

Our analysis uses the highest federal tax bracket, full payment of the Obamacare surtax and the assumption that our investors live in high-tax California:  in other words, the worst case:
  1. Top federal marginal rate on ordinary income (short-term capital gains tax rate) = 39.6%
  2. Federal long-term capital gains rate of 20%, plus 3.8% investment income Obamacare surtax = 23.8%
  3. California top marginal tax rate (applies equally to ordinary income, short-term and long-term gains) = 13.3%
  4. Total tax rate (fed plus state) on short-term gains = 39.6% + 13.3% = 52.9%
  5. Total tax rate (fed plus state) on long-term gains = 23.8% + 13.3% = 37.1%
 Source for tax rates:  Tax Foundation 2014
 
 
Results
 
Below we provide our results.  If you are evaluating the use of our strategies for some of your taxable accounts, you can use the numbers below to make a rough apples-to-apples comparison with Buy & Hold by subtracting the percentage below from the annualized returns of our strategies.    For each strategy, we include results under three scenarios:  the Buy & Hold investor liquidates at the end of 25, 30 and 35 years.  Taxes paid are highly dependent on your individual circumstances and you should rely on a professional for advice.  
 
Again, for tax-deferred accounts, like traditional IRAs or SEPs or tax-free accounts, like Roth IRAs, the analysis in this section is not relevant!  This only applies to taxable accounts. 

Additional Before-Tax Annualized Return (CAGR) Required for Our Strategies to Equal a Buy & Hold Strategy:
 
Safeguard 1st Strategy Compared with Buy & Hold
  • Buying & Holding for 25 years:       1.60%
  • Buying & Holding for 30 years:       1.84%
  • Buying & Holding for 35 years:       2.04%
 
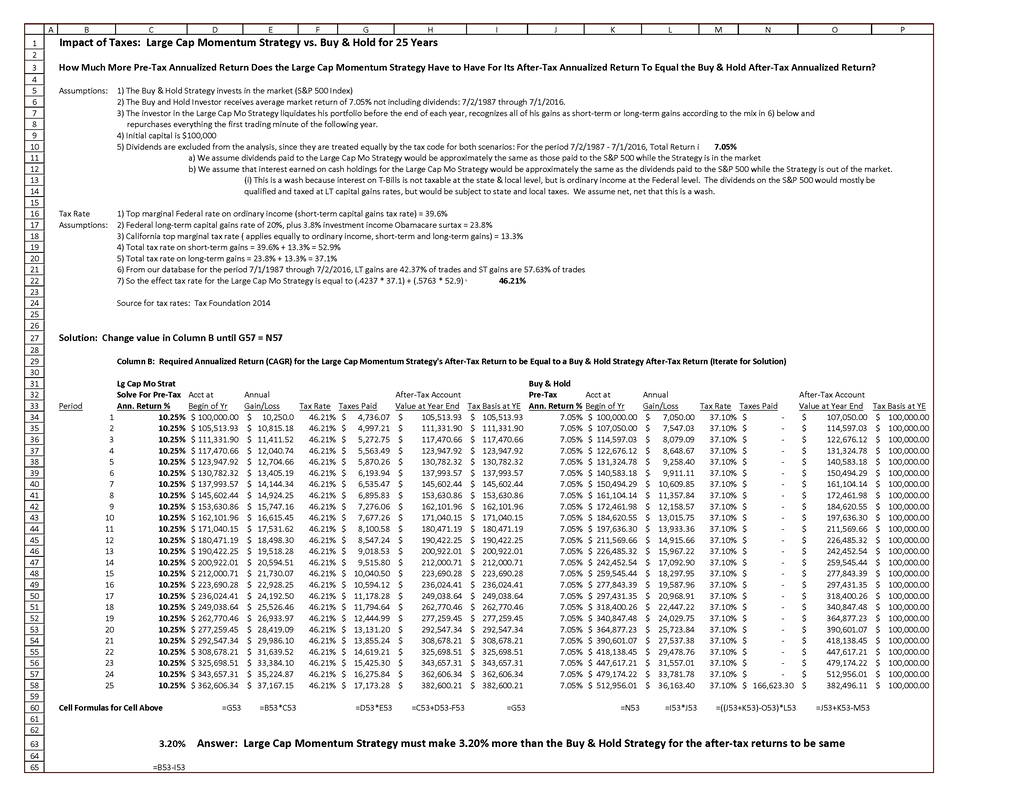
Large Cap Momentum Strategy Compared with Buy & Hold
  • Buying & Holding for 25 years:       3.20%
  • Buying & Holding for 30 years:       3.49%
  • Buying & Holding for 35 years:       3.74%
 
Small Cap Momentum Strategy Compared with Buy & Hold
  • Buying & Holding for 25 years:       4.37%
  • Buying & Holding for 30 years:       4.73%
  • Buying & Holding for 35 years:       5.03%
 
 High Turn Momentum Strategy Compared with Buy & Hold
  • Buying & Holding for 25 years:       5.95%
  • Buying & Holding for 30 years:       6.35%
  • Buying & Holding for 35 years:       6.69%

​A spreadsheet that demonstrates the calculations described above for the Large Cap Momentum strategy is below.  (Click to enlarge).  ​We are happy to share the details of our analysis with prospective clients and/or their tax advisors.
Picture


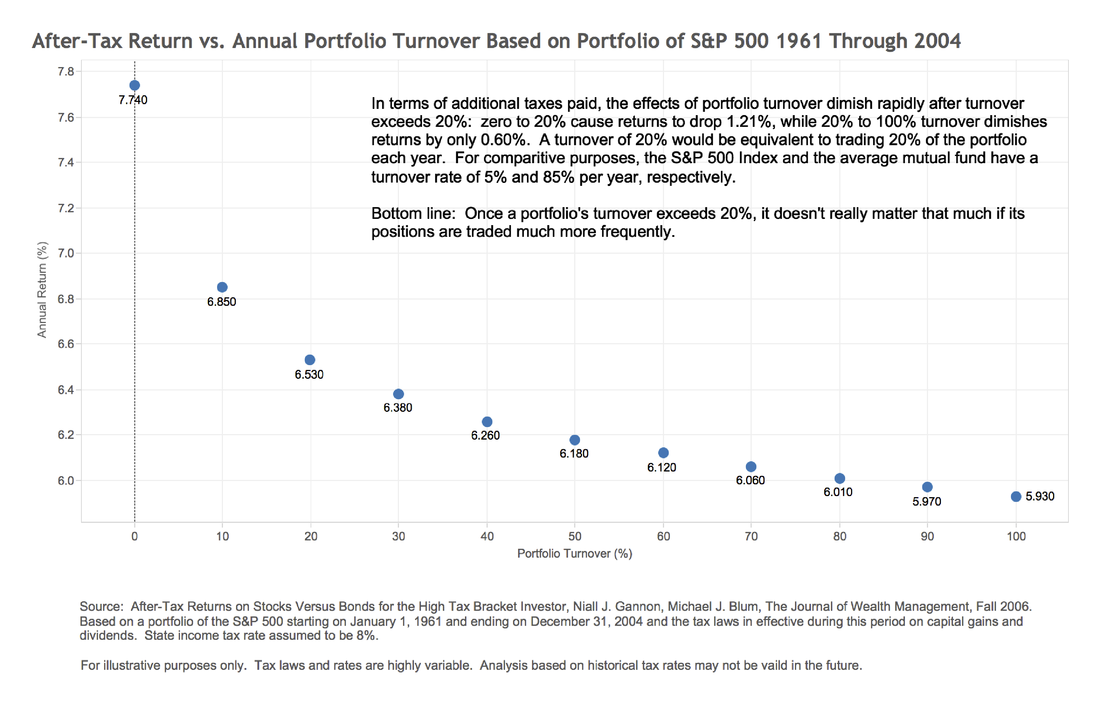
​How Turnover of Positions Effects Taxes Paid
 
Many claim that excessive turnover of portfolio investments dramatically reduces returns because of the tax bill that is generated.  One interesting finding of our research is that once you deviate from pure Buy & Hold, you lose much of the tax advantages of a Buy & Hold Strategy.  Take a look at the chart below.  The steepest loss of returns occurs due to the first 5-10% of turnover.  Once a portfolio’s turnover exceeds 20% per year, it really doesn’t matter if positions are traded much more frequently. 
Picture


​To further explore this topic see these academic papers.
Disclosures & Backtesting Results Disclaimer
Contact
Legal
Privacy Policy
Internet Communications Notice