|
The Achilles Heel of the 60/40 Portfolio: When Stocks and Bonds Go Down Together
|

|
The 60% stock/40% bond portfolio has long formed the backbone of the traditional, asset-allocation strategy. This relationship is predicated on the commonly held rationale that stocks will rise as bonds are declining, and vice versa, which smoothes out the fluctuations in the value of a portfolio, thereby reducing risk. The drawdowns the portfolio experiences will be moderated. Now for this to work properly two conditions must be met. First, bond prices need to move in the opposite direction of stock prices. Second, the relationship between bond prices and stock prices needs to be stable. The measures for this are 'correlation” and "correlation stability." The word “correlation” can cause eyes to glaze over, but it is important to understand, as it is the key concept for portfolio management. In simple terms, correlation tells you whether, on average, two assets have gone up and down at the same time or whether one tends to rise when the other is falling. Consider a two-asset portfolio, equally invested in equities and government bonds. When equities and bonds are positively correlated (a number between 0 and 1), this means that a decline in equity markets is normally accompanied by a decline in bond prices (and a rise in bond yields as the price of a bond is inversely related to its yield). With both asset classes falling, our two-asset portfolio would fare particularly badly, but would also do particularly well if both markets were rising at the same time. If we think about the opposite scenario, where equities and bonds are negatively correlated (a number between -1 and 0), then declines in one asset class would be at least partially offset by gains in the other, leading to a smoother return profile. So, a portfolio of two negatively correlated assets will be less risky/volatile than if the assets are positively correlated. This is a key objective of portfolio diversification and why it is important to understand correlations. Correlations Impact the Riskiness of a Portfolio Over the long term based on history, the combined returns of both stocks and bonds can be relied upon to be steady, such that swings up and down in the portfolios value over its lifetime can be ignored: but as Brad Jones of Deutsche Bank stated in his presentation The Third Generation of Asset Allocation: |
|
“If you were sailing from New York to Bermuda, would you rely only on long-term average weather conditions, with no ability to adjust to deviations from average conditions during the voyage?"
|
|
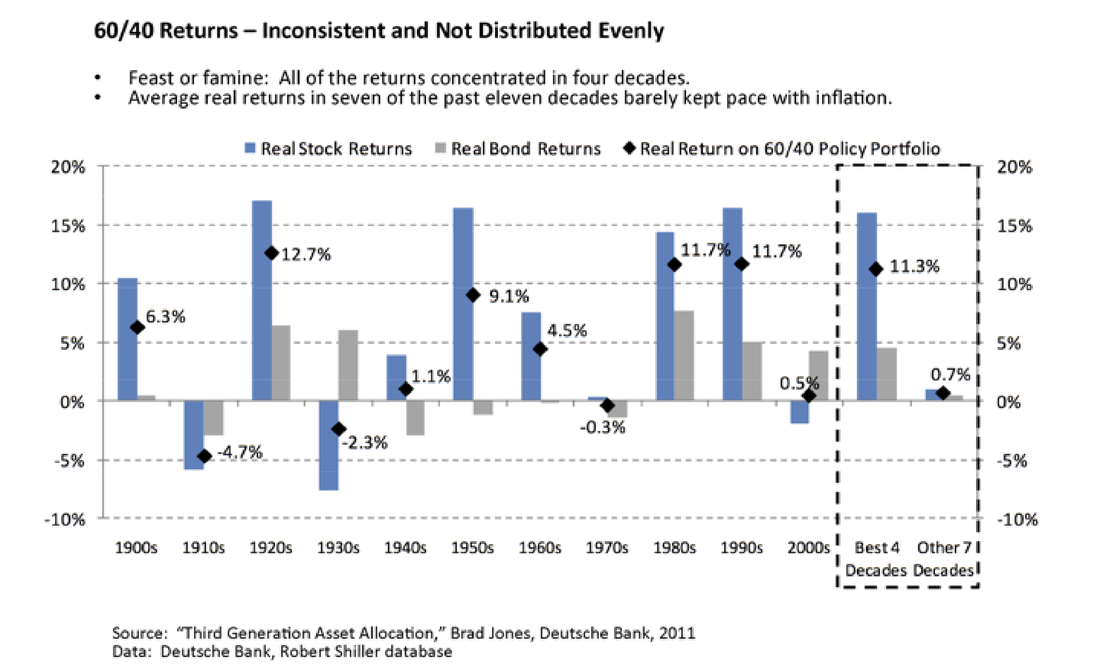
Historical Risk Profile in a 60/40 Portfolio Average annualized real returns from 60/40 portfolios for the period 1900 – 2011 have been 4.3%, but the path along the way has not been smooth! Take a look at the chart below. During that 1900 - 2011 timeframe, the returns where inconsistent and not distributed evenly. Almost all of the returns occurred during 4 out of 11 decades, with severe underperformance in 7 of 11 decades. What does this mean? It means if your timing is off and bonds and stocks are losing money at the same time, your portfolio may suffer loses from which it cannot recover. |
|
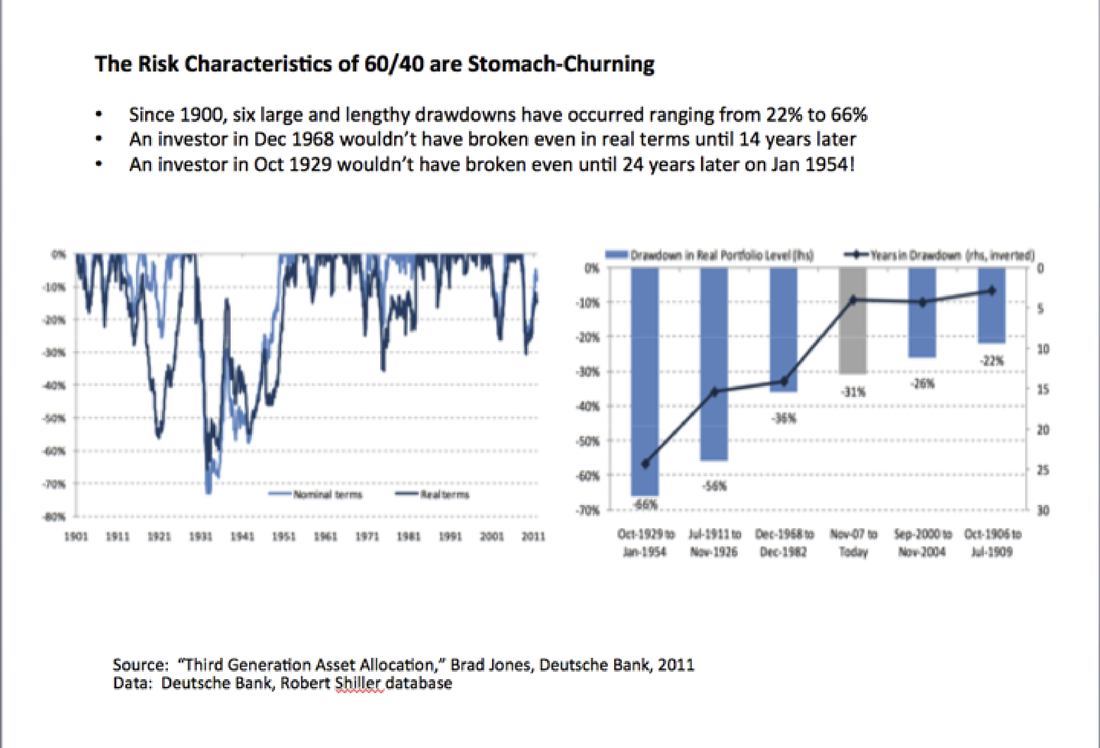
Long and Lengthy Drawdowns That You Are Supposed To “Wait Out” The information in the chart below is is just another way of looking at the risk characteristics of the 60/40 portfolio we described in the preceding section. |
|
Why Do 60/40 Portfolios Suffer Significant Periods of Underperformance and Drawdowns?
The short answer: there have been certain periods when stock and bonds became increasing correlated (moved up and down together): exactly the opposite of what we would have wanted to happen. During the last two bear markets (2000 and 2008), the correlation was negative and bonds held in portfolios insulated portfolios from losses – just as they were designed to do. But historically, bonds have not always moved in the opposite direction of stocks (1968, 1971, 1973 bear markets). In these situations bonds went down at the same time as stocks! The longer answer is below. Some facts about the correlations between bonds and stocks (1):
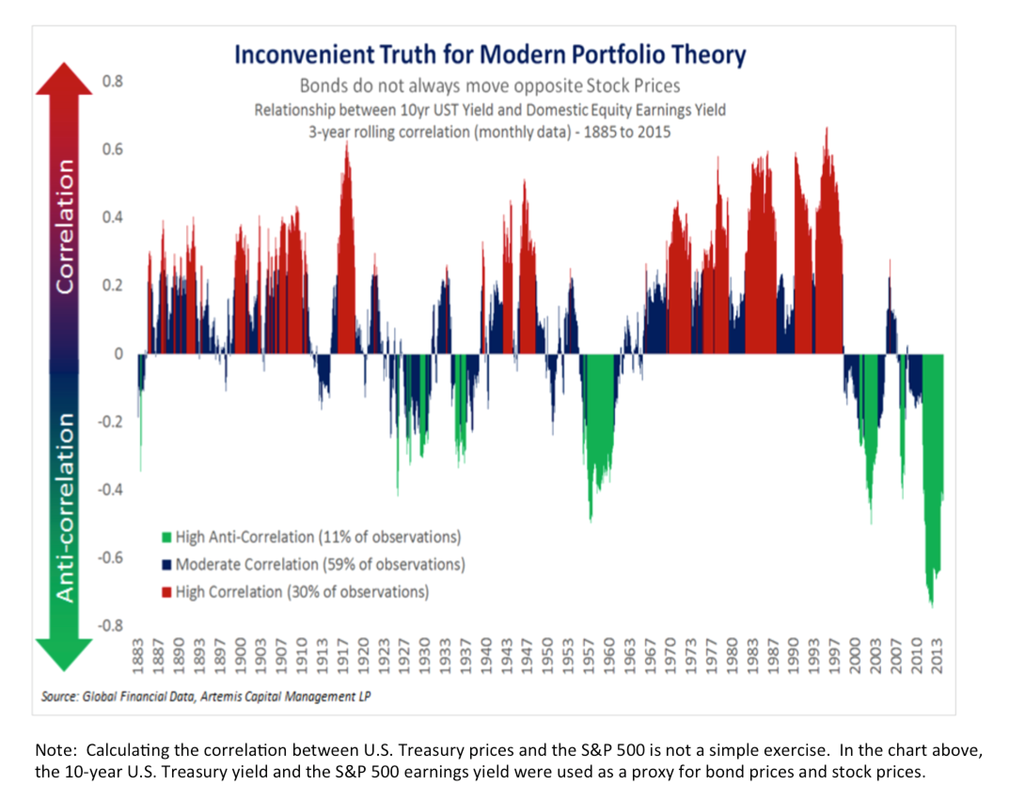
The nearby chart shows the approximate correlation between bonds and stocks from 1883 to 2013 and breaks it down into three classes
|
|
“Despite the recent 30 year bull market in bonds, the truth about the longer historical relationship between stocks and bonds is scary. Between 1883 and 2015 stocks and bonds spent more time moving in tandem (30% of the time) than they spent moving opposite one another (11% of the time). It is only during the last two decades of falling rates, accommodative monetary policy, and globalization that we have seen an extraordinary period of anti-correlation emerge between stocks and bonds unmatched by any other regime in history. Not only are stocks and bonds positively correlated most of the time, but there is a precedent for multi-year periods whereby both have declined.”
|
|
|
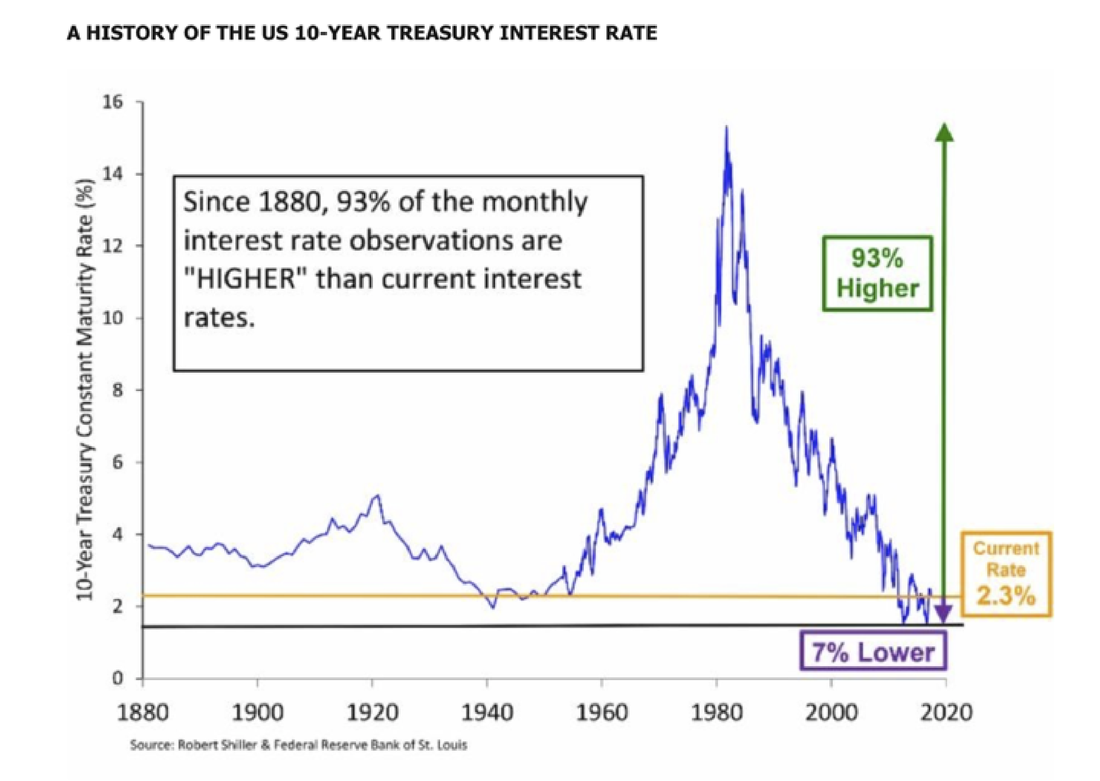
Key Takeaways The persistence of a negative correlation between bonds and stock over the last 20 years may have created a false sense of security among investors and especially, investment managers. Contrary to popular belief, periods of joint stock and bond underperformance occur with some frequency. In fact, they have marked the investor experience in nearly 25% of one-year rolling periods since the early 1970s (when measured by a 60%/40% combination of U.S. stocks/U.S. Treasuries). On top of this, bond yields across the globe are at historically extreme lows. Will the bonds in your portfolio really insulate your portfolio from the next market downturn? Or will the next period of instability in markets be one of the 25 percent in the past where both stocks and bonds go down together? It stands to reason that investors should seek to diversify against this potential occurrence, with investments that offer complementary return characteristics that are different from bonds. |