Schuler Capital Management LLC
  • Approach
    • What Makes Us Different
    • How We Work With Clients
    • About Us
  • Risk Model
    • Safeguard 1st Risk Model
    • Why Does It Work?
    • Risk Management vs Market Timing
    • Key Takeaways
    • What Is Safeguard 1st Telling Us Now? >
      • Current Safeguard 1st Signals
  • Strategies
    • Safeguard 1st Strategy
    • Large Cap Momentum Strategy
    • Small Cap Momentum Strategy
    • Custom Strategies
  • Reasons Why
    • Buy & Hold May Not Always Be Best
    • The Achilles Heel of the 60/40 Portfolio
    • Is Your Portfolio Really Diversified?
    • Gradually Shifting Asset Allocations Doesn't Effectively Manage Risk
    • Cash Is Not Trash
    • Fees Matter
    • What To Know About Track Records
  • Technical
    • Backtesting Methodology & Results >
      • Backtesting Description
      • Indicators & Risk Model: Description & Development
      • Safeguard 1st - Backtest Results
      • Large Cap Mo - Backtest Results
      • Small Cap Mo - Backtest Results
      • Dividend & Interest Assumptions
      • Transaction Cost Assumptions
    • Data Facts
    • Definitions >
      • Alpha
      • Beta
      • Black Swan
      • Correlation
      • Drawdown
      • Efficient Mkt Hypothesis
      • Market Timing
      • Profit Factor
      • Risk
    • More...Definitions >
      • Risk Measures >
        • Sharpe Ratio
        • Sortino Ratio
        • Standard Deviation
        • Volatility
      • R-Squared
    • Diversifying Company Risk
    • Momentum
    • Stop Loss Dangers
    • Tax Considerations
    • Timing of Signals/Trades
    • Using Our Charts/Tables
Drawdown, Maximum Drawdown %, Maximum Drawdown Duration, Net Profit As a % of Max Drawdown
 
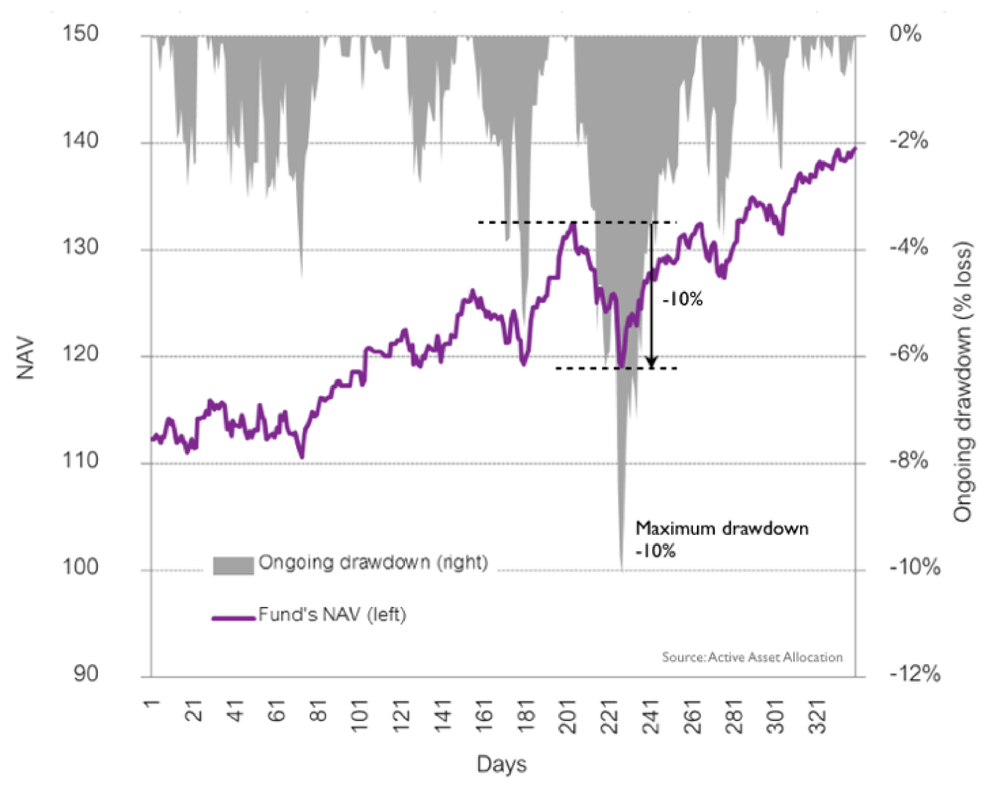
Drawdown is the simplest, most intuitive measure of risk.  To calculate drawdown, start with the current price, and then find the highest previous high (high-water mark).  Subtract the highest previous high from the current price and divide by the highest previous high.  (It is much easier to just look at the chart below!)​

Maximum Drawdown is the biggest drop in dollars from the previous high for the period in question.  Maximum Drawdown % is the Maximum Drawdown in dollars divided by the account’s previous all-time high value in dollars.
 
The chart below illustrates the concept of drawdowns.  The grey is the running percentage decline from the previous all time high (the drawdown %).  The purple line is the price of the asset and the maximum drawdown % for the period 1 to 321 days is -10%.​
Picture
For most investors, Maximum Drawdown % may the best measure of risk for two reasons:  1) Large drawdowns are the principle drivers of panic selling at the worst possible time, causing investor to lock in unrecoverable losses, and 2) Drawdowns can last many years in extended bear markets and if the investor needs to raise cash for an emergency or retirement, an investor may be forced to take major losses.  The longest drawdown for the period under consideration is called the Maximum Drawdown Duration and is usually measured in weeks.  It is defined as the time from the previous all-time high to the time when that all-time high is surpassed (peak to new peak).
 
Net Profit As A % Of Maximum Drawdown is the net profit gained by a strategy or investment over a given period divided by the maximum drawdown incurred during that time period.
Disclosures & Backtesting Results Disclaimer
Contact
Legal
Privacy Policy
Internet Communications Notice