|
Risk
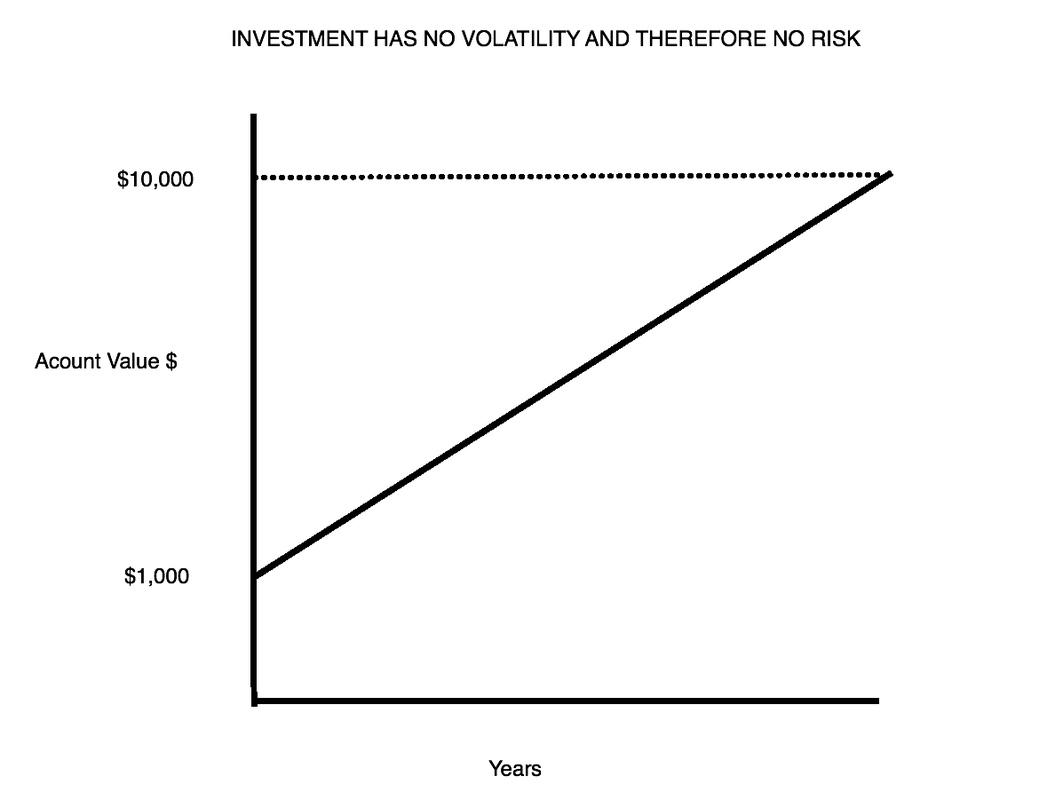
Definition: The chance that an investment's actual return will be different than expected. The only thing we know about risk is based on historical data from the specific investment we are evaluating or how an investment similar to it has performed in the past. The more volatility, the higher the probability is that we will lose money at any given point in the future compared with the historical average annual gain. What will happen is unknown and that is why it is risky. (The probability is also higher that we will make more money at any given point in the future than the average gain based on the past). Hopefully, the following graphs will help illustrate. Note that the amount of money made from each of the three investments is the same. Only the path to getting there is different. The first chart below shows an investment whose price has risen constantly in the past. It has no volatility and therefore no risk. This would be similar to a U.S. Treasury Bond held to maturity. |
|
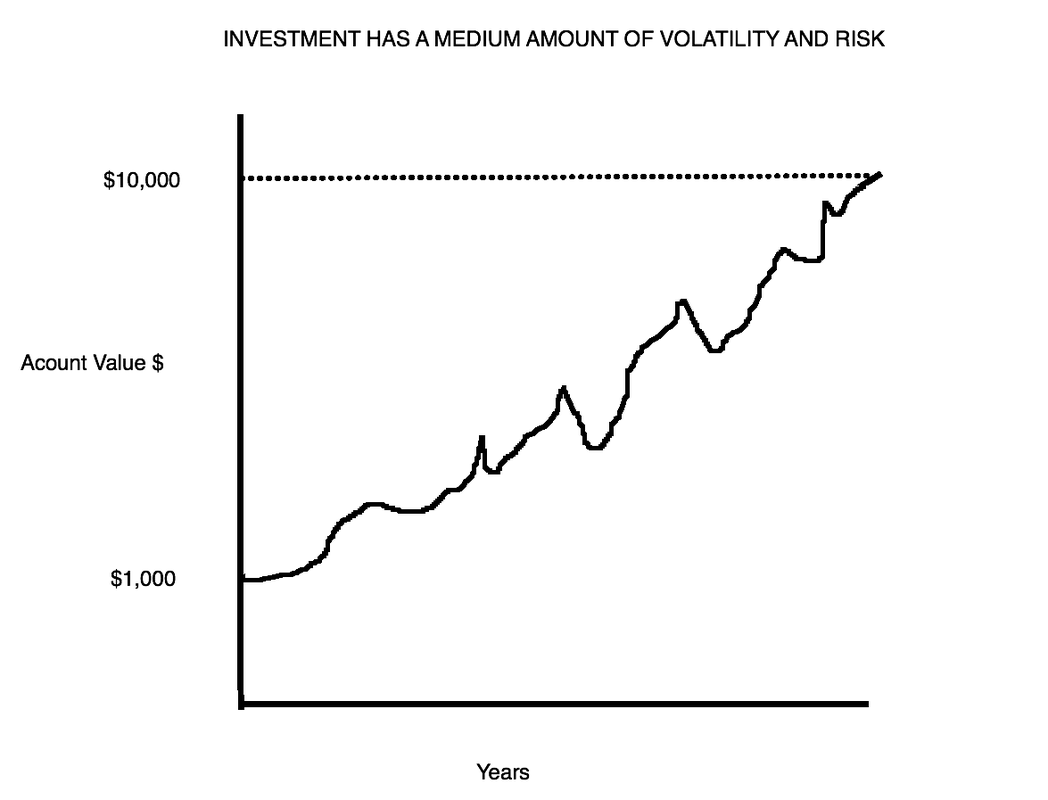
The second chart shows an investment whose price has varied in the past. In some instances, if an investor would have had to sell, s/he would have lost some of the money s/he had previously made, so it has some volatility and therefore some risk. |
|
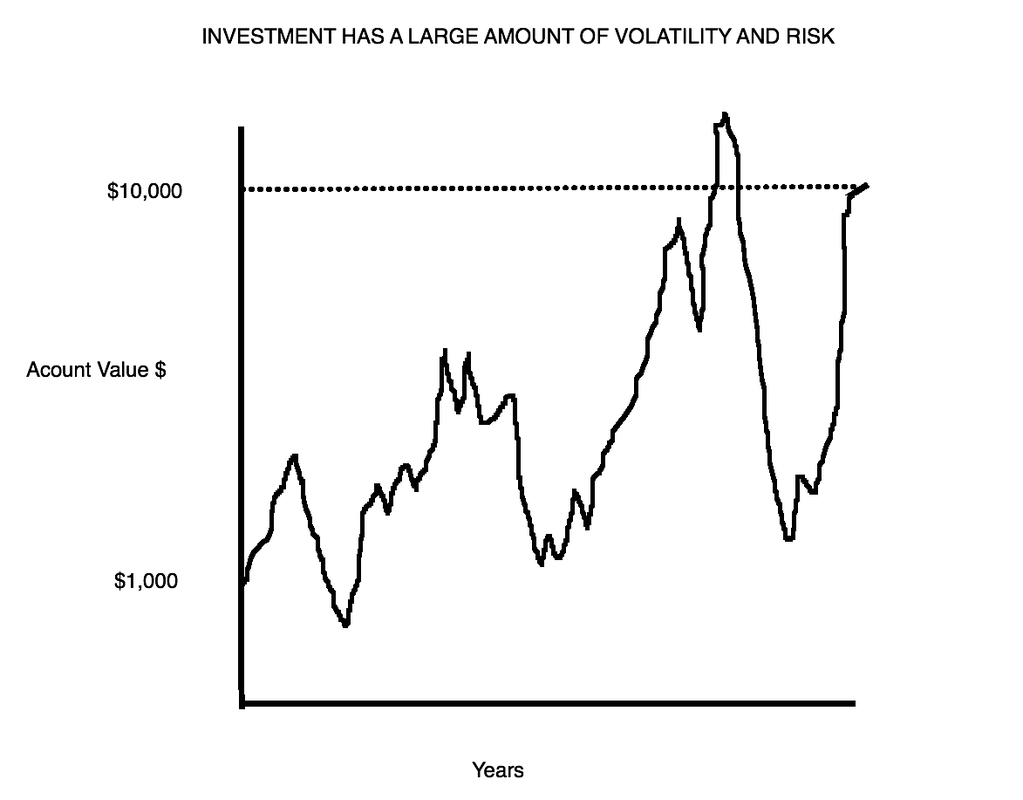
The third chart depicts a volatile investment, and while it historically appreciated, its value was subject to wild swings. This is a risky investment given its historical ups and downs and the uncertainty of what it will do exactly in the future. |
|
Measures of Risk With the Figures above fresh in your mind, let’s describe two measures of risk:
Risk-Adjusted Returns The risk-adjusted return is a measure of the return on an investment relative to the risk of that investment, over a specific period: the return per unit of risk. It is a mathematical construct, which can be used to compare different investments. Alpha, Sharpe Ratio and Sortino Ratio are some measures of risk-adjusted returns. Example Let’s say you invest in two different stocks, A and B. You believe, because A is a bigger, older company with consistent profit growth and returns on equity and B is much smaller, younger and less established, that B is riskier than A. You decide to invest in both A and B. So why did you invest in B if it’s riskier? The reason is that you believe B might grow faster than A in terms of profitability and/or stock price. In other words, as compensation for bearing more risk, you expect a higher return on your investment in B. Let’s say that after a few years, your portfolio statement shows that the returns on A and B are exactly the same. You might conclude that you would have been smarter to invest all that capital in A, because it would have been less risky. Your willingness to bear greater risk by owning B was not rewarded by a greater return. Stated another way, if two investments had the same return over a specific period, the less risky asset would have a better risk-adjusted return. On the other hand, let’s say that after a few years B has outperformed A spectacularly and did so with little volatility. You might conclude that you were very well compensated for the risk you assumed. Let’s look at a more common scenario, in which B slightly outperformed A in terms of the return on investment. Can you now definitively say that the risk you took on your investment in B was rewarded by a commensurately better return? Not unless you measure your risk-adjusted returns of both A and B. To reiterate, risk-adjusted return is a measure of the return in relation to the risk and is related to the historical "rockiness" of the path that lead to the returns. Measuring Risk-Adjusted Returns One of the major tenets of finance is that higher returns are associated with higher risk. The good way to understand this is to think about risk-adjusted returns of two portfolios. For instance, say Portfolio A yields 10% annualized return with 30% maximum drawdown and Portfolio B yields 5% annualized return with a 15% Maximum drawdown. If one used borrowed funds (assuming a cost to borrow equal to zero to simplify things) to double the amount held in Portfolio B, the risk and return would be the same for both portfolios. One could say the risk/return of Portfolio A and Portfolio B are roughly equivalent. (Of course in the real world the cost to borrow is not zero). In this case the Sharpe and Sortino ratios for Portfolio A and Portfolio B would be roughly the same for Portfolio A and B. While the example above provides an intuitive understanding of risk-adjusted returns, the Sharpe Ratio and the Sortino Ratio are measures that quantify it. The higher the Sharpe Ratio or Sortino Ratio for a strategy or porfolio is relative to what it is for the benchmark, the higher a portfolio's return is for the amount of risk being taken relative to that benchmark. If the Sortino Ratio or Sharpe Ratio is equal between two strategies then the return to risk of the strategies being compared is roughly equal. If the ratios are much higher, the return to risk is much higher. Our strategies, based on historical data, have typically produced Sharpe and Sortino ratios that were close to double what they were for their benchmarks. |