Schuler Capital Management LLC
  • Home
  • Approach
    • What Makes Us Different
    • How We Work With Clients
    • About Us
  • Risk Model
    • Safeguard 1st Risk Model
    • Why Does It Work?
    • Risk Management vs Market Timing
    • Key Takeaways
    • What Is Safeguard 1st Telling Us Now? >
      • Current Safeguard 1st Signals
  • Reasons Why
    • Buy & Hold May Not Always Be Best
    • The Achilles Heel of the 60/40 Portfolio
    • Is Your Portfolio Really Diversified?
    • Cash Is Not Trash
    • Fees Matter
    • What To Know About Track Records
Sharpe Ratio
 
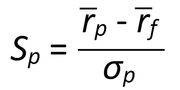
The Sharpe Ratio is a popular measure of risk-adjusting returns for comparing two investments.  It measures the return in excess of the risk-free rate divided by the volatility of that investment.  It therefore shows the ratio of return “per unit of risk.”  
 
Generally, the greater the value of the Sharpe ratio, the more attractive the risk-adjusted return compared to the benchmark.
 
For the more mathematically minded, the equation for the Sharpe Ratio:
Picture

​Where
            Sp = Sharpe Ratio
            Rp = The Average Period Return
            Rf = The Average Risk-Free Rate
            σp = Standard Deviation of the Portfolio or Asset Returns
Disclosures & Backtesting Results Disclaimer
Contact
Legal
Privacy Policy
Internet Communications Notice