Schuler Capital Management LLC
  • Approach
    • What Makes Us Different
    • How We Work With Clients
    • About Us
  • Risk Model
    • Safeguard 1st Risk Model
    • Why Does It Work?
    • Risk Management vs Market Timing
    • Key Takeaways
    • What Is Safeguard 1st Telling Us Now? >
      • Current Safeguard 1st Signals
  • Strategies
    • Safeguard 1st Strategy
    • Large Cap Momentum Strategy
    • Small Cap Momentum Strategy
    • Custom Strategies
  • Reasons Why
    • Buy & Hold May Not Always Be Best
    • The Achilles Heel of the 60/40 Portfolio
    • Is Your Portfolio Really Diversified?
    • Gradually Shifting Asset Allocations Doesn't Effectively Manage Risk
    • Cash Is Not Trash
    • Fees Matter
    • What To Know About Track Records
  • Technical
    • Backtesting Methodology & Results >
      • Backtesting Description
      • Indicators & Risk Model: Description & Development
      • Safeguard 1st - Backtest Results
      • Large Cap Mo - Backtest Results
      • Small Cap Mo - Backtest Results
      • Dividend & Interest Assumptions
      • Transaction Cost Assumptions
    • Data Facts
    • Definitions >
      • Alpha
      • Beta
      • Black Swan
      • Correlation
      • Drawdown
      • Efficient Mkt Hypothesis
      • Market Timing
      • Profit Factor
      • Risk
    • More...Definitions >
      • Risk Measures >
        • Sharpe Ratio
        • Sortino Ratio
        • Standard Deviation
        • Volatility
      • R-Squared
    • Diversifying Company Risk
    • Momentum
    • Stop Loss Dangers
    • Tax Considerations
    • Timing of Signals/Trades
    • Using Our Charts/Tables
Backtesting Description


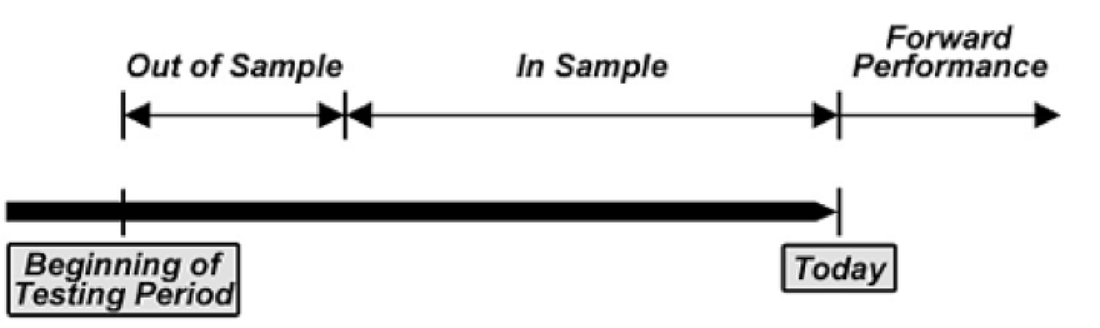
​How Do You Develop a Good Indicator, Model or Strategy?  Backtest To Establish Its Effectiveness.
 
Backtesting is the process of testing an investment strategy with historical data to ensure its viability before risking any actual capital.  An investment in a strategy can be simulated over an appropriate period of time and the results analyzed for the levels of profitability and risk.  The backtesting process is the same for indicators, models and strategies and we use these terms interchangeably in the discussion below.

The primary goal of backtesting is to simulate real investment experience using historical data.  For instance, if we were trying to develop an indicator for the S&P 500 Index, we would use the S&P 500 Index's historical pricing data.  First, we would develop a concept, say that if the S&P 500 Index crosses below its x-day moving average, we should sell and if it crosses above its x-day moving average, we should buy.  Then we would optimize to determine the value of x (the number of days in the moving average) that would yield the best results using a portion of the historical data (referred to as in-sample data).  Let's say the optimized value turns out to be 200 days.  Next, we would compare the results of the optimized backtest in-sample results with the results of a backtest with the same strategy and settings (sell if the price of the S&P crosses below its 200-day moving average and buy if it crosses above) in a different sample time period (referred to as out-of-sample data).

The backtesting process simulates investment in real-time, since the out-of-sample data were not considered in the optimization.  If the profitability and risk characteristics are similar for both samples, then the indicator, model or strategy can be deemed to be valid and robust, and it is ready to be implemented in real-time markets.  If the strategy fails in out-of-sample comparisons, then the strategy should be abandoned.  Further modifications made to improve the indicator or strategy by going back to the in-sample data create a high risk of "curve fitting" to the historical data, which nullifies the validity of the whole backtesting process and makes it statistically meaningless.
Picture

​
​We tested and refined the indicators (as well as our risk model and our strategies) using a portion of our historical data (in-sample testing).  We then evaluated the indicators with the rest of our historical data to simulate how they would perform in real life (out-of-sample testing).
 
Normally, the performance of the out-of-sample tests is worse than the in-sample tests.  This stands to reason, because inputs could be modified in the in-sample testing to improve the results.   Out-of-sample testing is based on the statistically valid notion that it provides an unbiased estimate of the indicator’s future performance.  If the out-of-sample results are almost as good as the in-sample results, the indicator has merit.
 
Valid, robust indicators (models, strategies) have common characteristics:

  • They are based on an intuitive, sound econometric or rational basis, and not on random discovery of patterns.  Without an accurate understanding of how and why an indicator/strategy produces the patterns that we see, we cannot know whether or for how long the indicator/strategy will continue to produce accurate signals in the future.
  • They are based on ample data history.  While not always possible, we normally want at least 30 signals (buys or sells) to confirm the indicator’s significance.  See Number of Signals in Data Facts section.
  • They are conceptually simple and use a minimum number of parameters.  Enrico Fermi was famously know for quoting 20th Century mathematician John von Neumann, “With four parameters I can fit an elephant, and with five I can make him wiggle his trunk.”  What did von Neumann mean by this?  He meant by using enough input variables (parameters) in a model, one can get any result one wants by curve fitting.
    • The greater the number of parameters used to determine the indicator/strategy and the more complex it is, the greater chance that data mining/excessive curve fitting has occurred and the less likely the indicator/strategy will work in the real world.
Picture
Disclosures & Backtesting Results Disclaimer
Contact
Legal
Privacy Policy
Internet Communications Notice