|
Safeguard 1st Strategy - Backtest Results
Important Information: Performance results do not include investment advisory fees of any kind (for example, an advisory fee of 1% compounded over a 10 year period would reduce a 10% return to an 8.9% annual return). The impact of taxes on results is not included. Dividends from investments in stocks and interest from investments in short-term fixed income securities are not included in the results. Performance results shown here have not been independently audited. Estimates for slippage and commissions are included. Investing in the S&P 500 Total Return Index, or any other index, is not possible and it is used here only as a proxy for the stock market in general. Unless otherwise stated, performance results for indicators, models and strategies are hypothetical, based on backtesting using historical data, and are not a reflection of actual investment results. Past performance, whether actual or indicated by historical tests, is no guarantee of future performance or success. The risks of substantial losses are inherently part of our investment strategies and our strategies may be more volatile than the benchmark indices used for comparison. Real-time investing results presented here may differ from the results that have been or will be achieved in actual client accounts depending on cash levels held, actual transaction costs incurred, advisory fees and taxes paid and other factors. Prospective clients should see “Important Disclosures & Backtesting Results Disclaimer” in the footer of schulercapital.com or contact us directly for more information.
|
|
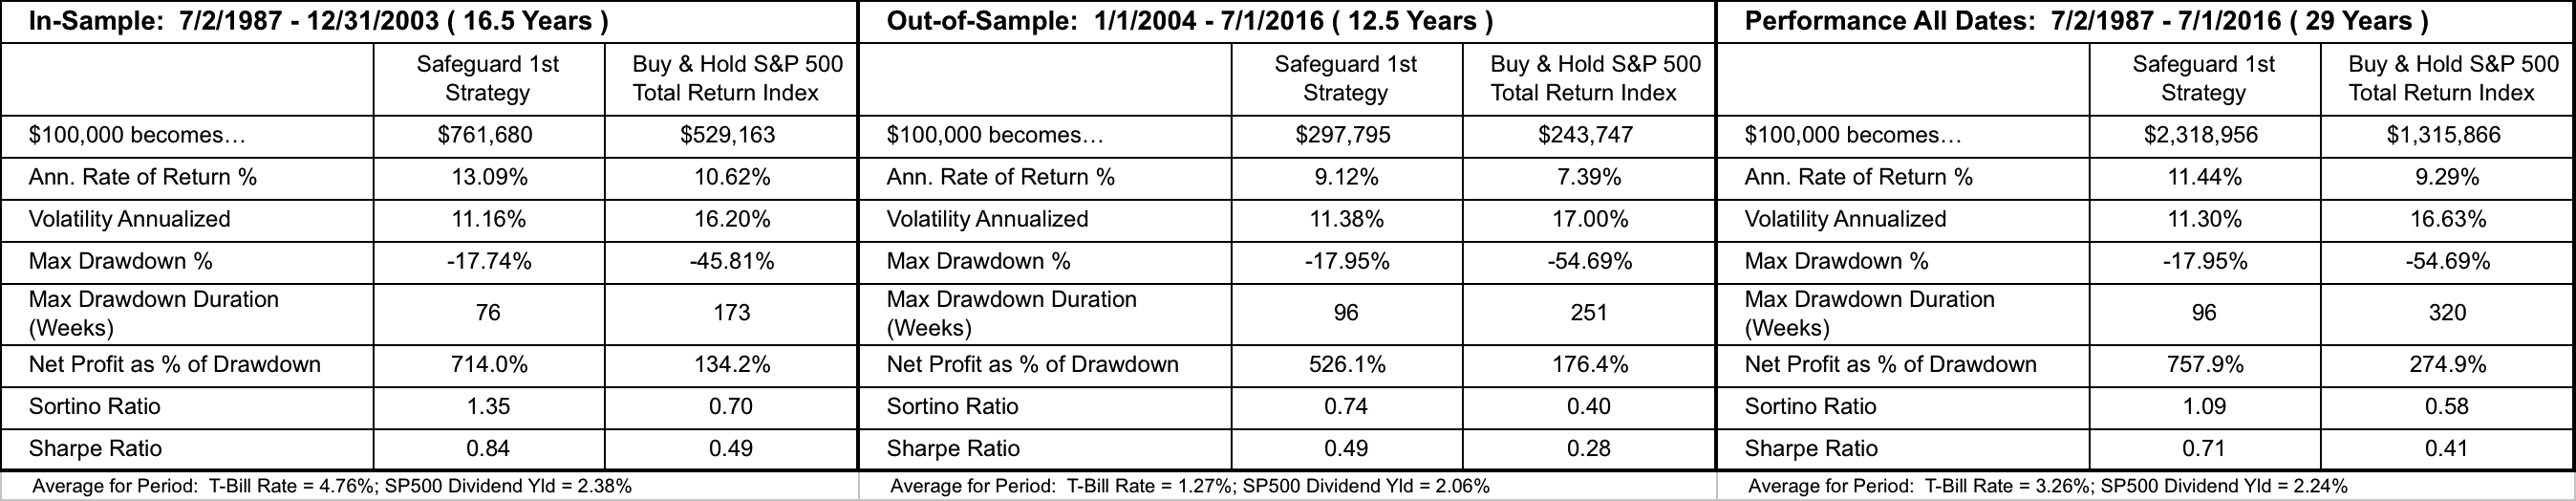
Backtest Results We present the charts and tables below which provide the results for our backtesting of the Safeguard 1st Strategy. The in-sample period was from 7/2/1987 to 12/31/2003 (16.5 years). The out-of-sample period was from 1/1/2004 to 7/1/2016 (12.5 years). The strategy has been trading in real time since 7/1/2016. Note: More information about our charts and tables can be found at Using Our Charts/Tables. Details about the backtesting we performed can be found at Backtesting Methodology & Results. Definitions for many technical terms can be found in Definitions. Click on charts/tables to enlarge. |
|
|

|
|
Buy signals are generated when the Safeguard 1st Risk Model’s score crosses above 1 (becomes a 2) and sell signals are generated when its score crosses below 0 (becomes a -1). We rely on the Safeguard 1st Risk Model signals to determine when we are in the market and when we are out of the market. |
|
|
|
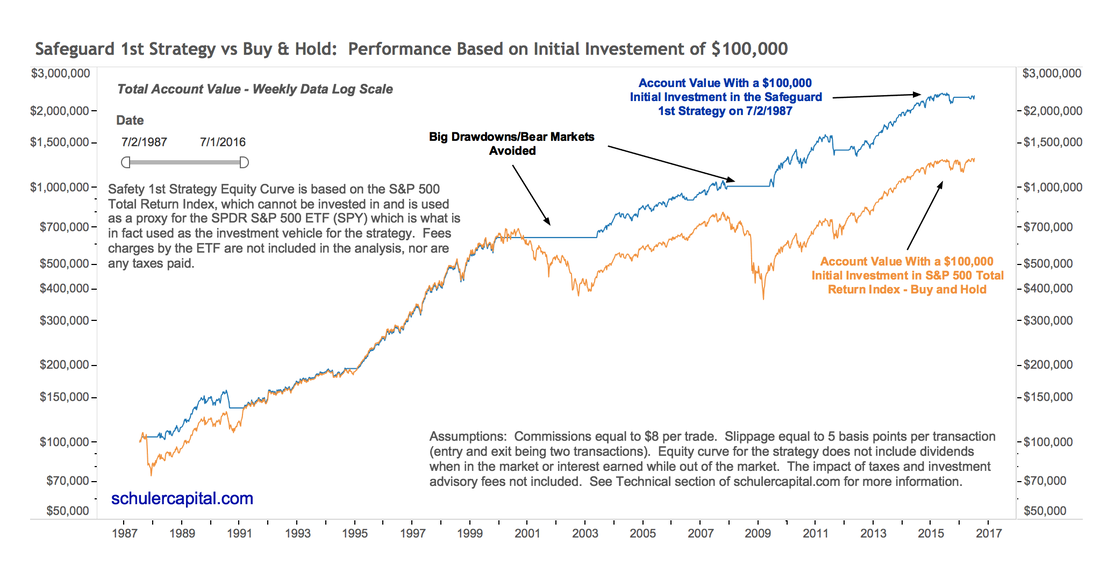
Equity Curve Chart
The Equity Curve graph below shows what the total account value would have been on 7/1/2016 if a $100,000 initial investment had been made on 7/2/1987 – 29 years earlier. |
|
|
The Equity Curve chart clearly illustrates two things based on historical data:
|
|
|
|
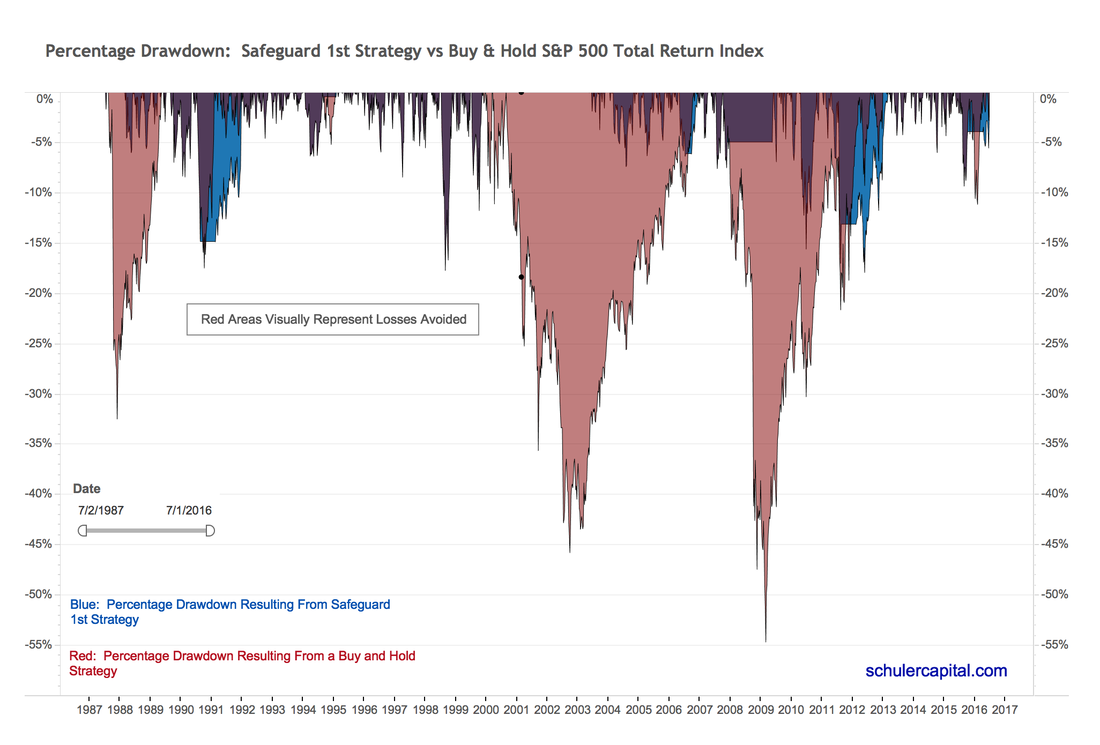
Drawdown Chart
Percentage drawdown is defined as the total loss in percentage terms from the previous, all-time high in the account. A more detailed explanation of drawdown can be found here. The red in the chart represents the losses an investor would have experienced from the previous high if s/he had invested in the S&P 500 and implemented a Buy & Hold strategy for 29 years. The blue in the chart shows the losses the same investor would have experienced from the previous high had s/he invested in the Safeguard 1st Strategy. |
|
|
The risk protection of the Safeguard 1st Strategy is illustrated here. For Buy & Hold, the maximum drawdown percentage occurred in March of 2009, at 54.69%. But look at what the Safeguard 1st Strategy did. It signaled to get out of the market on 11/30/2007 and to get back into the market on 5/22/2009. The total drawdown for the 2008-2009 Great Financial Crisis would have been limited to 4.95%! The Drawdown Chart graphically shows that, based on historical data for the entire 29-year history, the Safeguard 1st Risk Model would have reduced an investor's losses significantly during the 29-year period. (Remember past performance is not a guarantee of future results. See Important Information above). Performance Table
Our Performance Table is a summary of the backtesting we performed. Click on the table for a better image. |
|
|
Links to the definitions of the risk measures in the Performance Table are included below. A quick summary of the Performance Table for the Safeguard 1st Strategy: Return Measure Results
Risk Measure Results
|
|
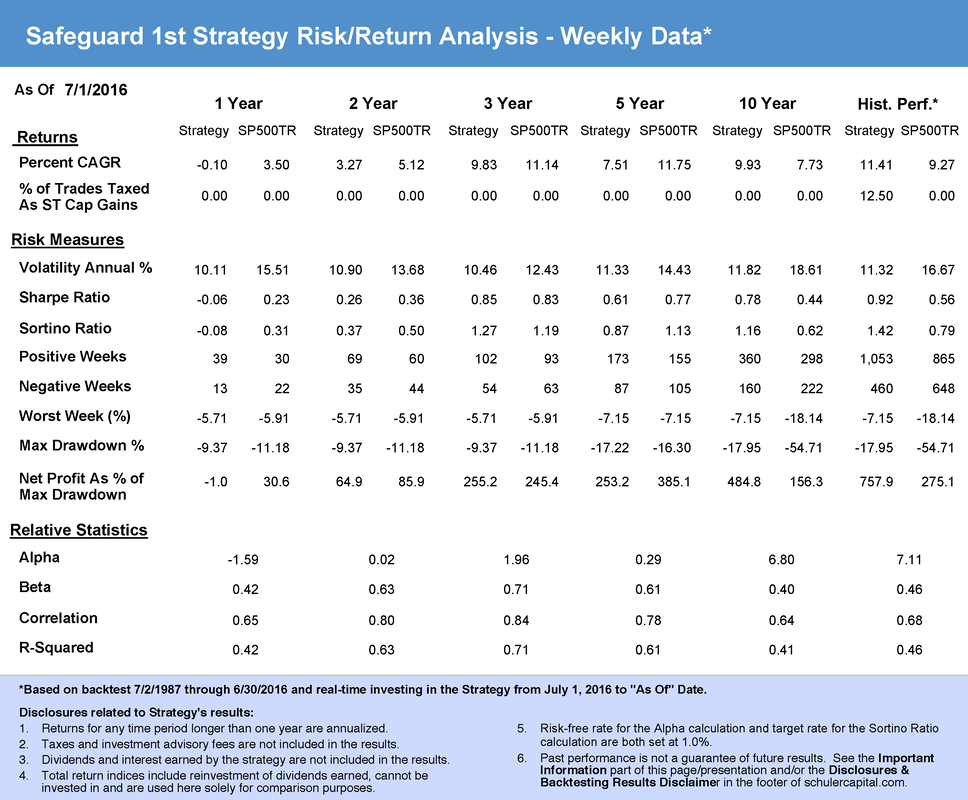
Risk/Return Analysis Table
The Risk/Return Table provides performance results for various periods, e.g. 1-year, 2-year, 3-year, 5-year, etc. prior to the "As of" date when the report was produced. Performance highlights for the period 7/2/1987 through 11/10/2017 in the Risk/Return Analysis Table (the far-right column) :
|
|