
|
> Overview
|
An Introduction
|
I am now a quant, meaning I use quantitative methodologies to invest. I wasn’t always. My preferred approach was a combination of fundamental and technical analysis. After many years of investment decision making and extensive research, I am convinced that objective, data-driven indicators and models are the best approach to increasing returns and decreasing risk. Why? Because they remove emotion and ego from the investment decision-making process and impose systematic discipline.
Now historical data and verifiable results drive my investment decisions based on a model that determines when the markets are risky and when they are not. And we have developed a number of strategies, which use this risk model as a foundation, that are tailored to our clients’ risk profiles and investment preferences. One of our guiding principles in developing our strategies was to “question everything,” including all of our existing beliefs. The results of this process led to significant insights and truths that I believe are responsible for the significant outperformance that our strategies achieve. The details of our findings and results are contained throughout this website, but I want to share some of the main ones with you now. Let’s start with results. Our strategies produce returns that historically outperform those of common benchmark portfolios, as well as similar competing strategies. More importantly, they do this with significantly reduced volatility and drawdowns. In the process of developing and testing quantitative approaches and comparing the results of widely-used investment strategies and funds, it became apparent that published results are often distorted with misleading information about returns and risk: risk-adjusted measures of returns are infrequently provided or explained. Moreover, the impact of fees, taxes and transaction costs on investment outcomes are often not incorporated. In my analysis, I wanted to quantify clearly the impact of risk, fees, transaction costs and taxes for myself objectively. I felt that separating truth from fiction would be of benefit not only to me, but to others as well. Lastly, and most importantly, I discovered that a new approach, one that breaks with convention, with a total commitment to risk management was required to effectively reduce risk. Its manta: “Don’t focus on making money, focus on not losing money.” Much more about this later. My sincerest hope is that the work we have done will be useful to you. If you have been looking for an alternative investment with reasonable fees where you maintain control of your money and your brokerage account, I believe our firm can help you. If you are worried about the impact of the next market melt down on your portfolio, I believe our risk-managed strategies can benefit you. If you are not satisfied with high-fee, low-return mutual funds, our momentum strategies offer the opportunity for much higher returns with less risk. And finally, if the allocation level of bonds in your portfolio and the possibility of losses due to rising interest rates worry you, our strategies are ideally suited to address your concerns. If any or all of this sounds appealing, I invite you to read on. OverviewWhat Makes Us Different?
How We Work With Clients
|
|
Seven Samurai Risk Model What is a Risk Model? A risk model is the combination of a number of reliable, objective indicators based on historical data used to assess the level of risk* in the market. The Seven Samurai Risk Model is a composite of seven indicators. *Risk can be thought of as the likelihood that you will lose a lot of money. How Was the Seven Samurai Risk Model Created? The Seven Samurai Risk Model is created from the sum of the signals and scores for each of the seven indicators. The selection and weightings for the indicators were determined through a process called backtesting to validate the Risk Model's effectiveness in determining the most risky and least risky times to be in the market. How It Works Take a look at the chart below (click on it for a better view in your browser). The top half is a chart of the S&P 500 Index, our proxy for the stock market. In the bottom half of the chart, the green line is the final sum of the scores of our seven indicators added together: our Seven Samurai Risk Model results. The horizontal lines are thresholds that generate buy and sell signals when the green line crosses above or below them. You can see the buy and sell signal arrows in the top chart. |

|
Buy signals are generated when the Seven Samurai Model’s score crosses above 1 (becomes a 2) and sell signals are generated when its score crosses below 0 (becomes a -1). Notice that we do not get signals very often, but when we do very few have been false signals and the timing has been excellent for identifying risky times to be in the market. We rely on the Seven Samurai signals to determine when we are in the market and when we are out of the market. Our next chart is the Drawdown Chart. Drawdown is defined as the total loss in percentage terms from the previous, all-time high in the account. The definition of drawdown can be found here. The red in the chart represents the losses you would have experienced from the previous high if you had invested in the S&P 500 and implemented a Buy & Hold strategy for 29 years. The blue in the chart shows the losses you would have experienced from the previous high had you followed the Seven Samurai buy and sell signals. |

|
The value of the Seven Samurai Model is illustrated here vividly. You can see that the maximum drawdown percentage occurred in March of 2009, at 56.24% for Buy & Hold. But look at what the Seven Samurai did. It got out of the market on 11/30/2007 and limited the maximum drawdown percentage to only 21.95%! In fact, the Drawdown Chart graphically shows that for the entire 29-year history, the Seven Samurai Risk Model would have reduced your losses significantly. Key Points Regarding The Seven Samurai Risk Model
Our Investment Strategies Using our risk management system as a foundation, we have developed a number of investment strategies: |
|
Safeguard 1st Strategy
Performance vs Buy & Hold - 7/1/1987 through 11/10/2017*
*Unless otherwise stated, performance results for indicators, models and strategies are hypothetical, based on backtesting using historical data, and are not a reflection of actual trading/investment results. Past performance, whether actual or indicated by historical tests, is no guarantee of future performance or success. Please see Disclaimer. 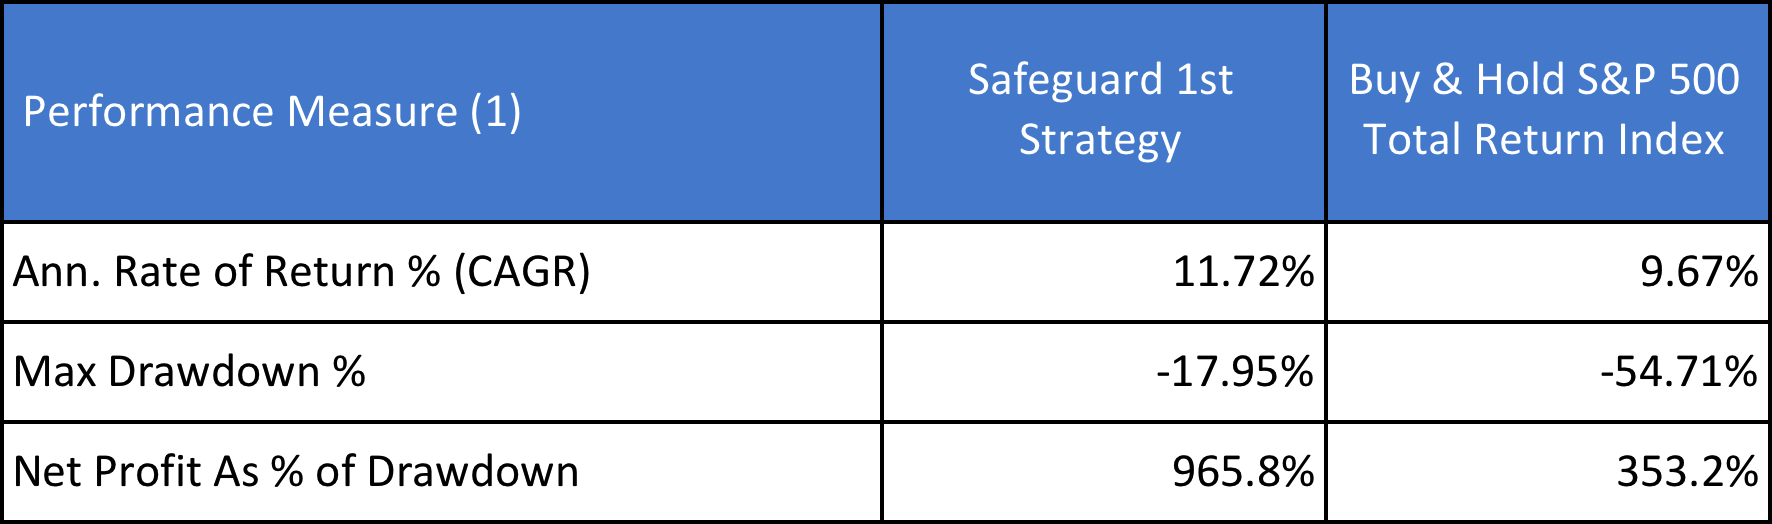
|
|
(1) Definitions can be found here.
In-sample data 7/2/1987 - 12/31/2003; Out-of-sample data 1/2/2004 - 7/1/2016; Real-time trading 7/2/2016 - 11/10/2017. Results are before taxes. The impact of taxes are estimated in the Tax Considerations section for each strategy. Results include estimated transaction costs. Social-Impact Investing Strategy
We understand that you may want to use your wealth to help others and make the world a better place. You value social responsibility as a factor when making investment decisions. Social-Impact Investing, sometimes referred to as Environmental, Sustainable and Governance (ESG), brings together both the fundamental and the practical: your goals for social responsibility and the need to preserve and grow your wealth. Performance vs. Buy & Hold
Theoretical performance similar to Safeguard 1st Strategy. Large Cap Momentum Strategy
Performance vs Buy & Hold - 7/1/1987 through 11/10/2017*
*Unless otherwise stated, performance results for indicators, models and strategies are hypothetical, based on backtesting using historical data, and are not a reflection of actual trading/investment results. Past performance, whether actual or indicated by historical tests, is no guarantee of future performance or success. Please see Disclaimer. 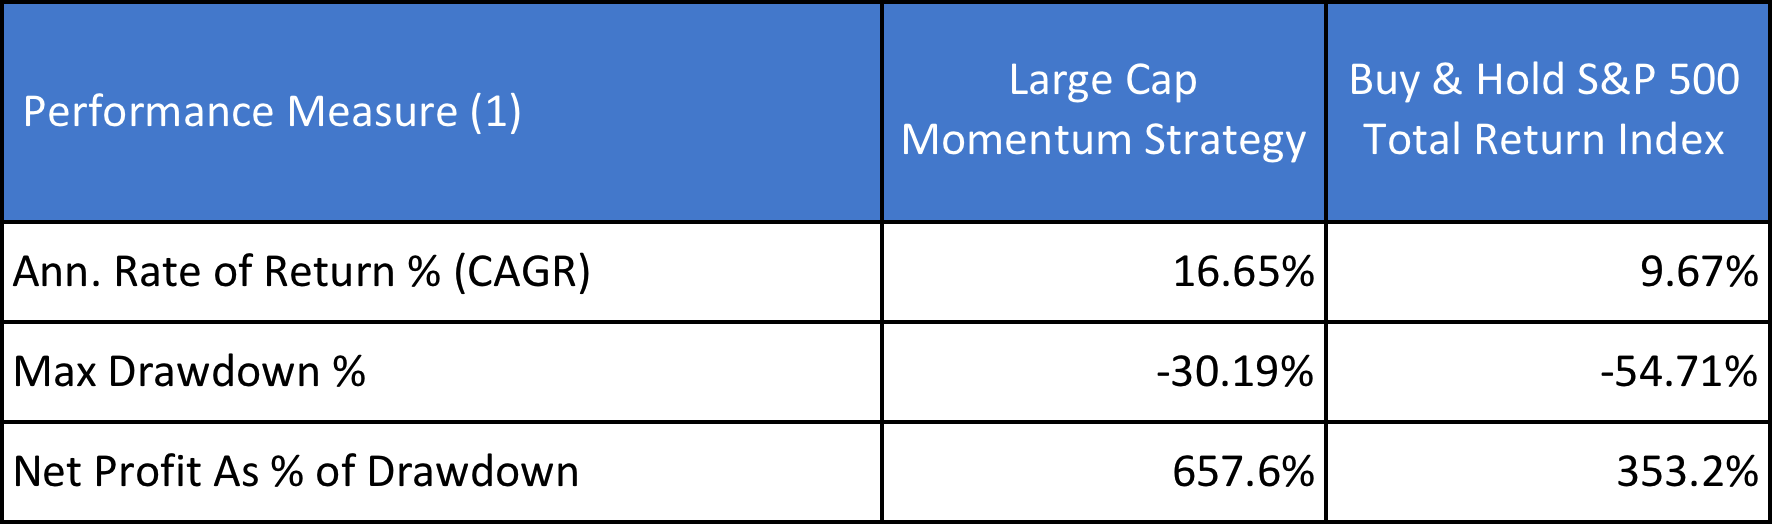
(1) Definitions can be found here.
In-sample data 7/2/1987 - 12/31/2003; Out-of-sample data 1/2/2004 - 7/1/2016; Real-time trading 7/2/2016 - 11/10/2017. Results are before taxes. The impact of taxes are estimated in the Tax Considerations section for each strategy. Results include estimated transaction costs. |
|
Small Cap Momentum Strategy
Performance vs Buy & Hold - 7/1/1987 through 11/10/2017*
*Unless otherwise stated, performance results for indicators, models and strategies are hypothetical, based on backtesting using historical data, and are not a reflection of actual trading/investment results. Past performance, whether actual or indicated by historical tests, is no guarantee of future performance or success. Please see Disclaimer. 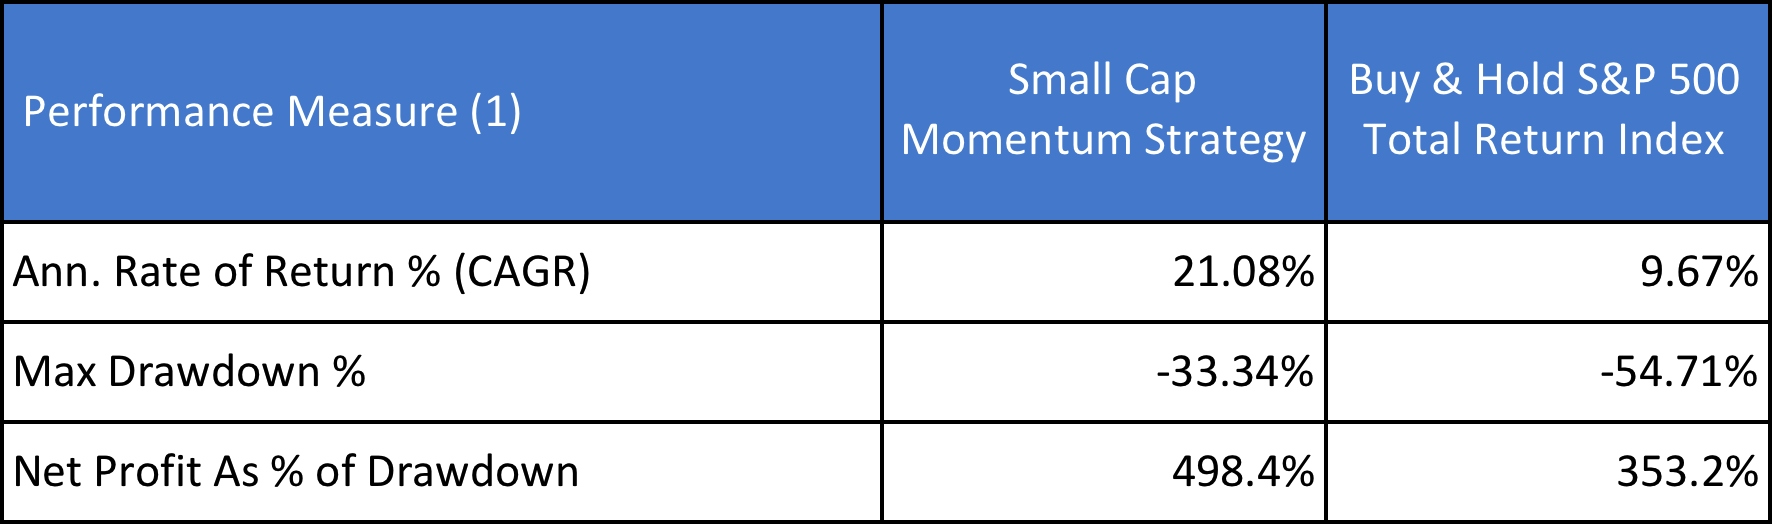
(1) Definitions can be found here.
In-sample data 7/2/1987 - 12/31/2003; Out-of-sample data 1/2/2004 - 7/1/2016; Real-time trading 7/2/2016 - 11/10/2017. Results are before taxes. The impact of taxes are estimated in the Tax Considerations section for each strategy. Results include estimated transaction costs. Reasons Why
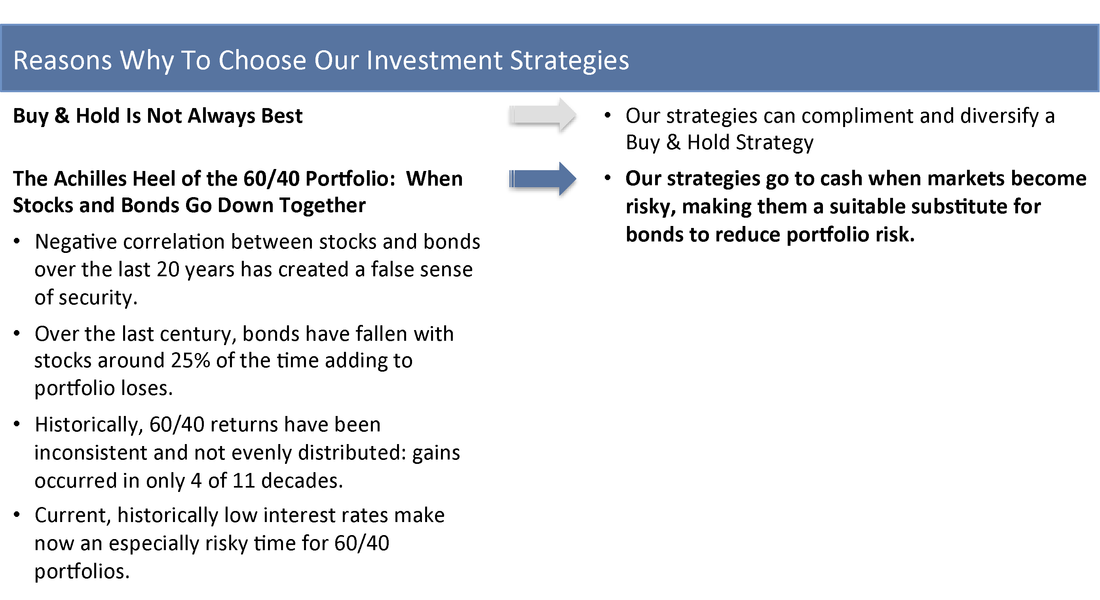
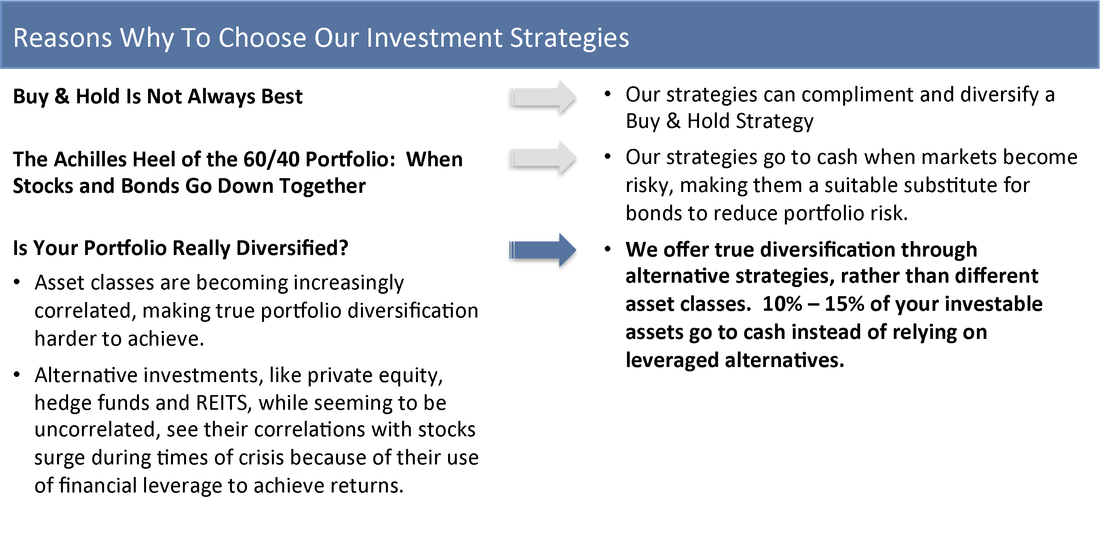
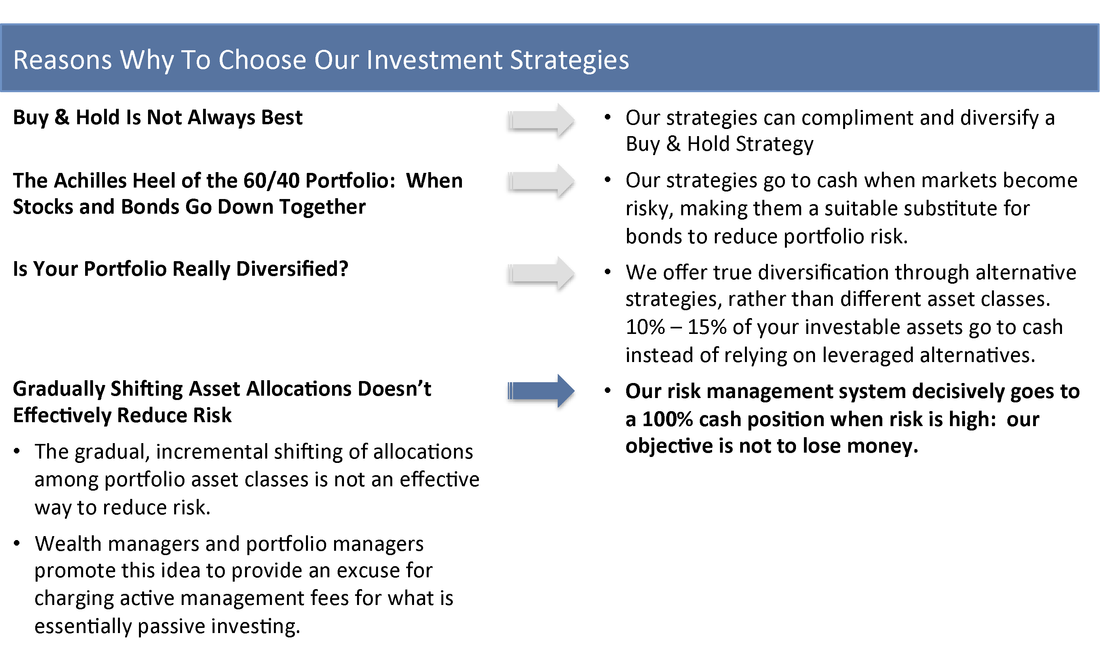
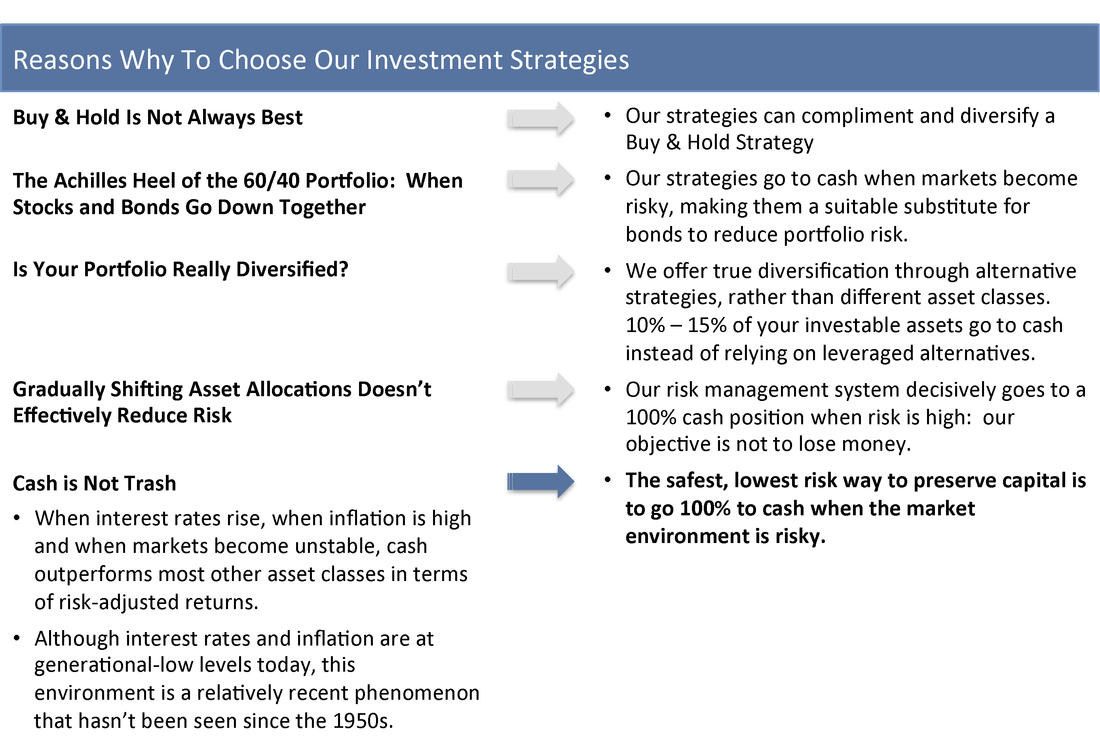
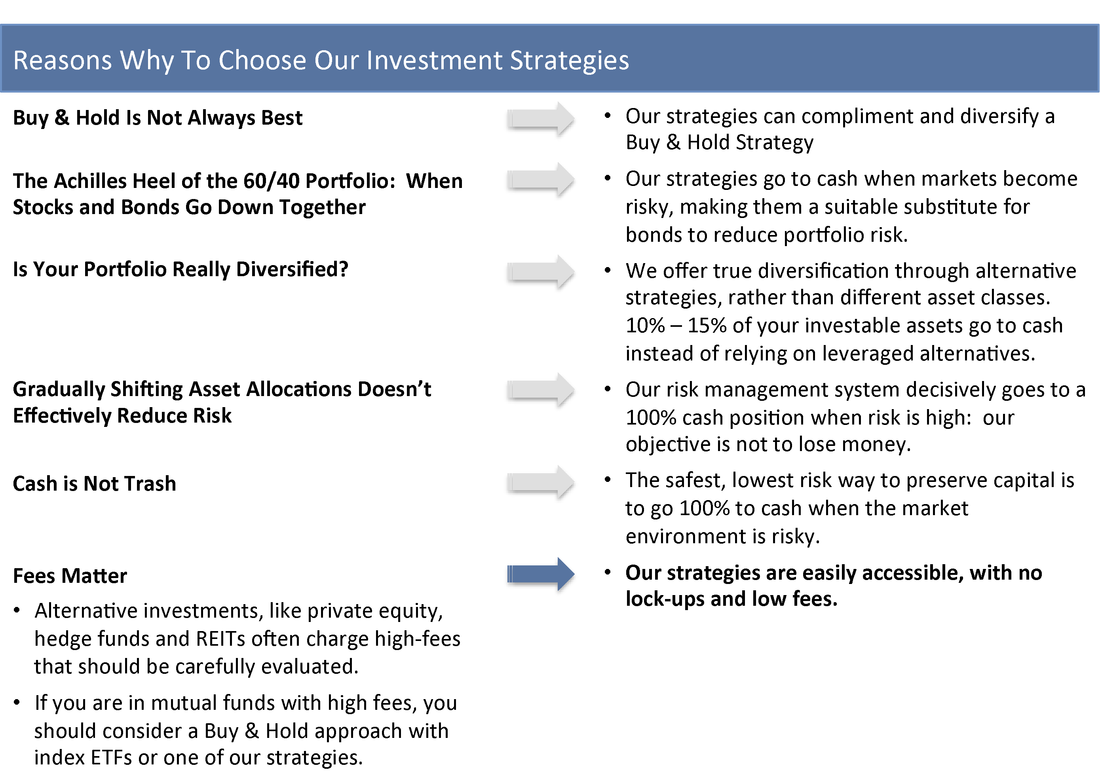
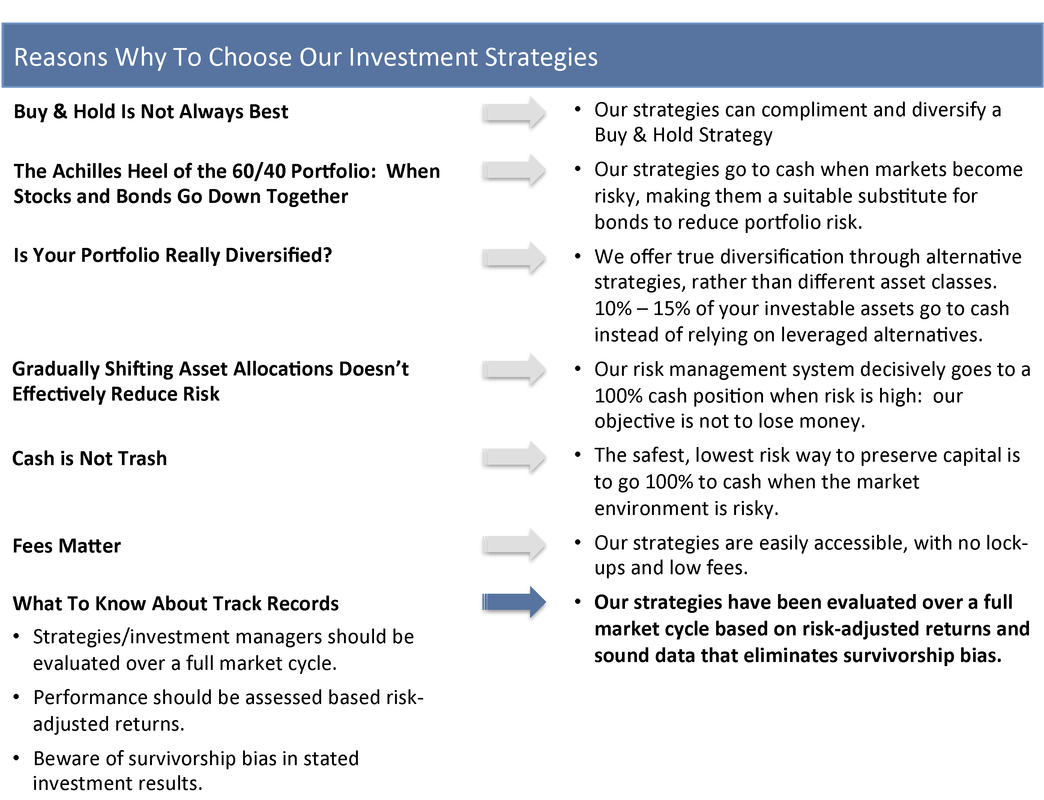
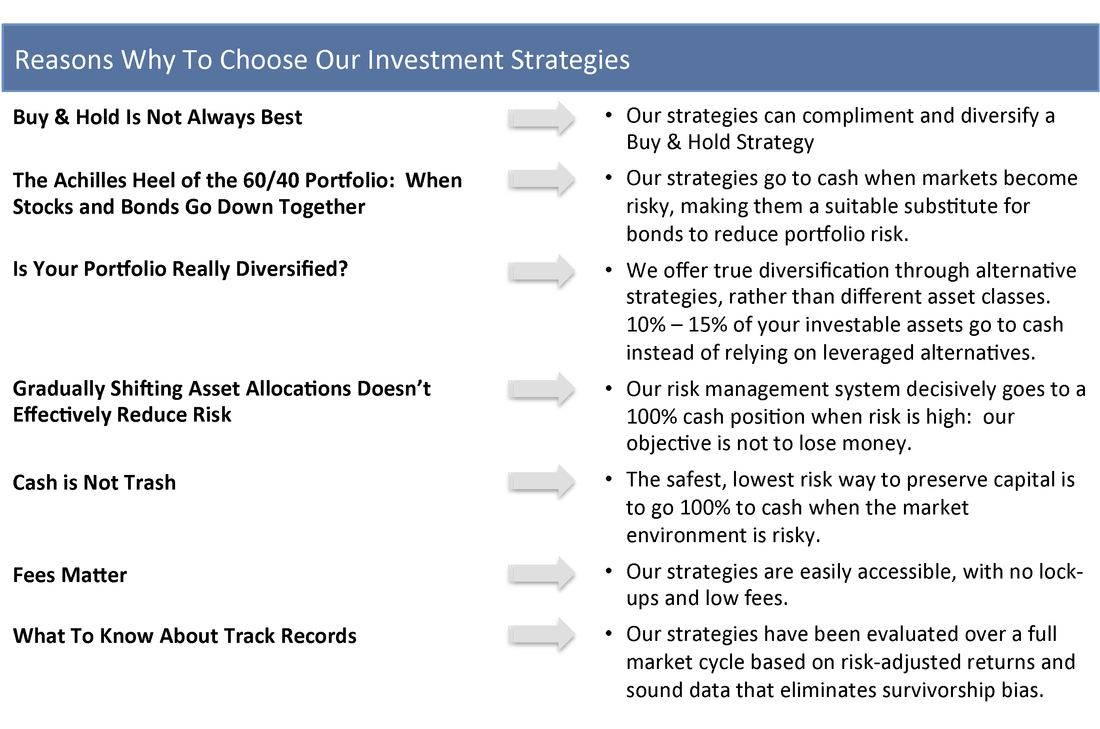
Aside from the superior risk-adjusted returns delivered by our strategies, you should consider other reasons for adopting them as part of your portfolio. Here we summarize the Reasons Why section of our website which highlights important points that explain why the context of today’s investment environment makes our strategies and approach especially suitable and why you should consider our strategies as part of your portfolio of investments. 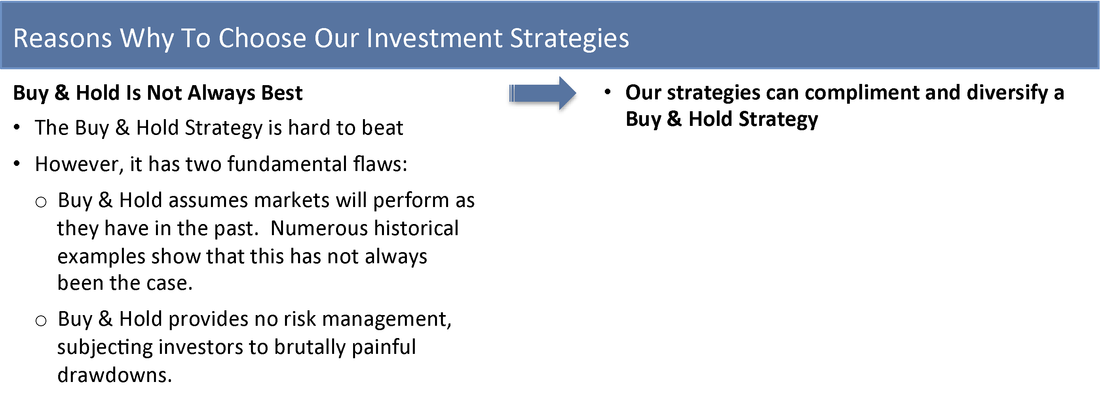
We hope this overview was helpful and that you enjoy the data, charts and other content that the rest of our website provides.
|