|
Safeguard 1st Risk Model
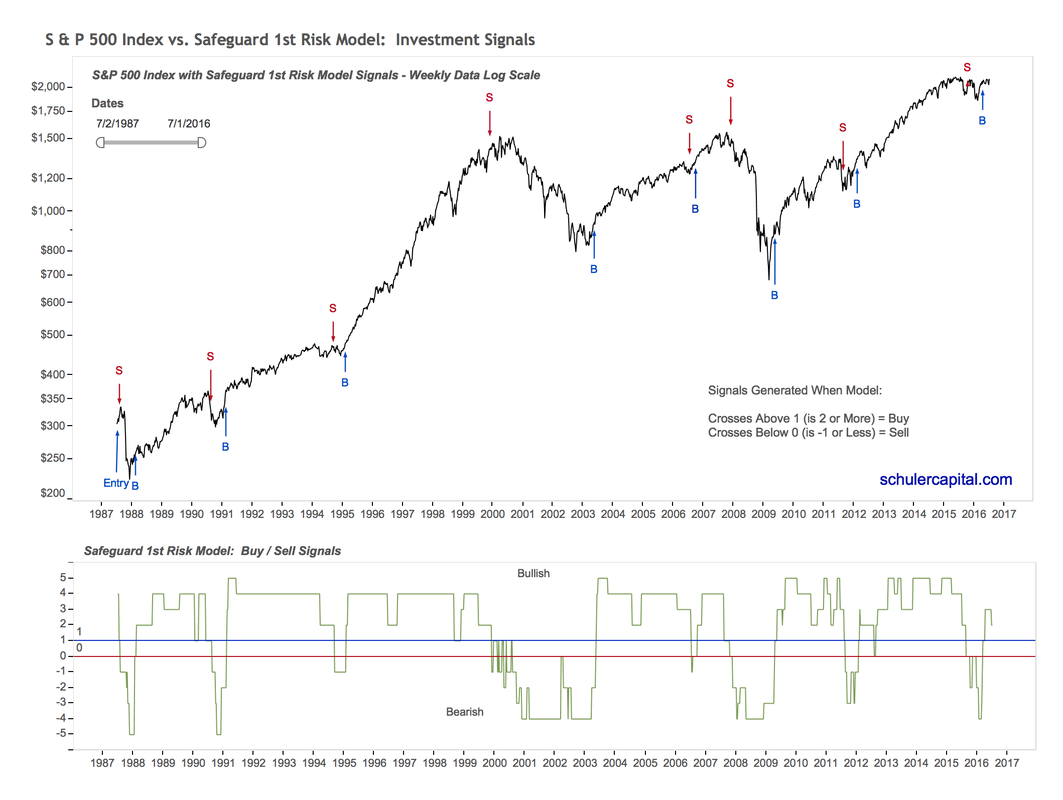
The Path Is As Important As The Destination All of us want to enjoy life. The whole reason to have money is to be able to spend our time the way we want. We remember major bear markets not only because they make us miserable with worry, but also because they often scare us into doing the exact wrong thing at the exact wrong time. A recent study shows that the pain caused by losing money is double the pleasure from making money. Our focus on risk management first – don’t lose money – is designed to avoid the crushing drawdowns and swings in wealth that our clients might experience on the way to achieving their investment goals. The desire to manage risk was the motivation behind the development of our Safeguard 1st Risk Model. What is a Risk Model? A risk model is the combination of a number of reliable, objective indicators based on historical data used to assess the level of risk* in the market. The Safeguard 1st Risk Model is a composite of seven indicators: four are breadth indicators, one is a trend indicator, and two are monetary indicators. More about how our indicators and how they were developed can be found here. *Risk can be thought of as the likelihood that you will lose a lot of money. For a more in-depth explanation of risk click here. How Was the Safeguard 1st Risk Model Created? The Safeguard 1st Risk Model is created from the sum of the signals and scores for each of the seven indicators. The selection and weightings for the indicators were determined through a process called backtesting to validate the Risk Model's effectiveness in determining the most risky and least risky times to be in the market. The process for doing this is the same as for developing indicators and a detailed explanation can be found here. How It Works Take a look at the chart below (click on it for a better view in your browser). The top half is a chart of the S&P 500 Index, our proxy for the stock market. In the bottom half of the chart, the green line is the final sum of the scores of our seven indicators added together: our Safeguard 1st Risk Model results. The horizontal lines are thresholds that generate buy and sell signals when the green line crosses above or below them. You can see the buy and sell signal arrows in the top chart. |
|
Buy signals are generated when the Safeguard 1st Risk Model’s score crosses above 1 (becomes a 2) and sell signals are generated when its score crosses below 0 (becomes a -1). Notice that we do not get signals very often, but when we do, very few have been false signals and the timing has been excellent for identifying risky times to be in the market. We rely on the Safeguard 1st signals to determine when we are in the market and when we are out of the market. |