|
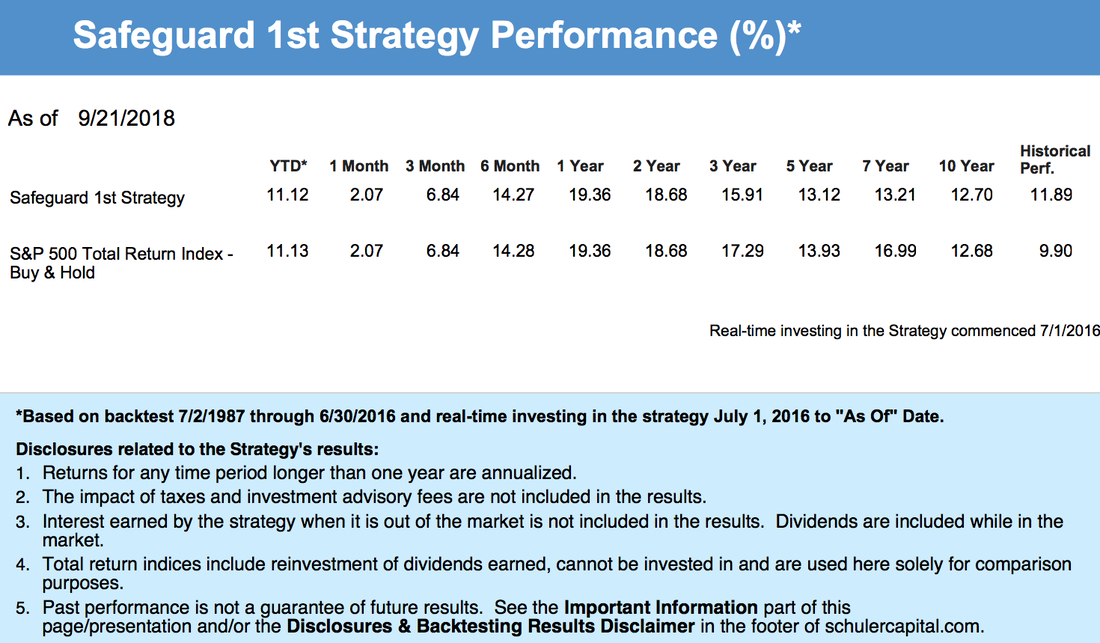
Safeguard 1st Strategy

Performance results do not include investment advisory fees of any kind (for example, an advisory fee of 1% compounded over a 10 year period would reduce a 10% return to an 8.9% annual return). The impact of taxes on results is not included. Dividends from investments in stocks and interest from investments in short-term fixed income securities are not included in the results. Performance results shown here have not been independently audited. Estimates for slippage and commissions are included. Investing in the S&P 500 Total Return Index, or any other index, is not possible and it is used here only as a proxy for the stock market in general. Unless otherwise stated, performance results for indicators, models and strategies are hypothetical, based on backtesting using historical data, and are not a reflection of actual investment results. Past performance, whether actual or indicated by historical tests, is no guarantee of future performance or success. The risks of substantial losses are inherently part of our investment strategies and our strategies may be more volatile than the benchmark indices used for comparison. Real-time investing results presented here may differ from the results that have been or will be achieved in actual client accounts depending on cash levels held, actual transaction costs incurred, advisory fees and taxes paid and other factors. Prospective clients should see “Important Disclosures & Backtesting Results Disclaimer” in the footer of schulercapital.com or contact us directly for more information.

We believe in applying empirical, data-driven research to uncover strong, quantitative equity strategies. We have conducted research covering 30 to 50 years of market data to identify the characteristics that historically have led to superior risk-adjusted returns. This research forms the basis for each of our strategies. Our process is generally transparent. Investments are selected programmatically based on our proprietary strategies and Safeguard 1st Risk Model. Short-term market events are not allowed to distract us from our disciplined approach to investing.

|

|
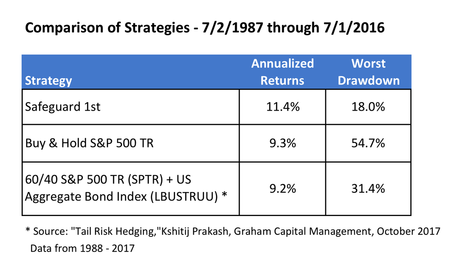
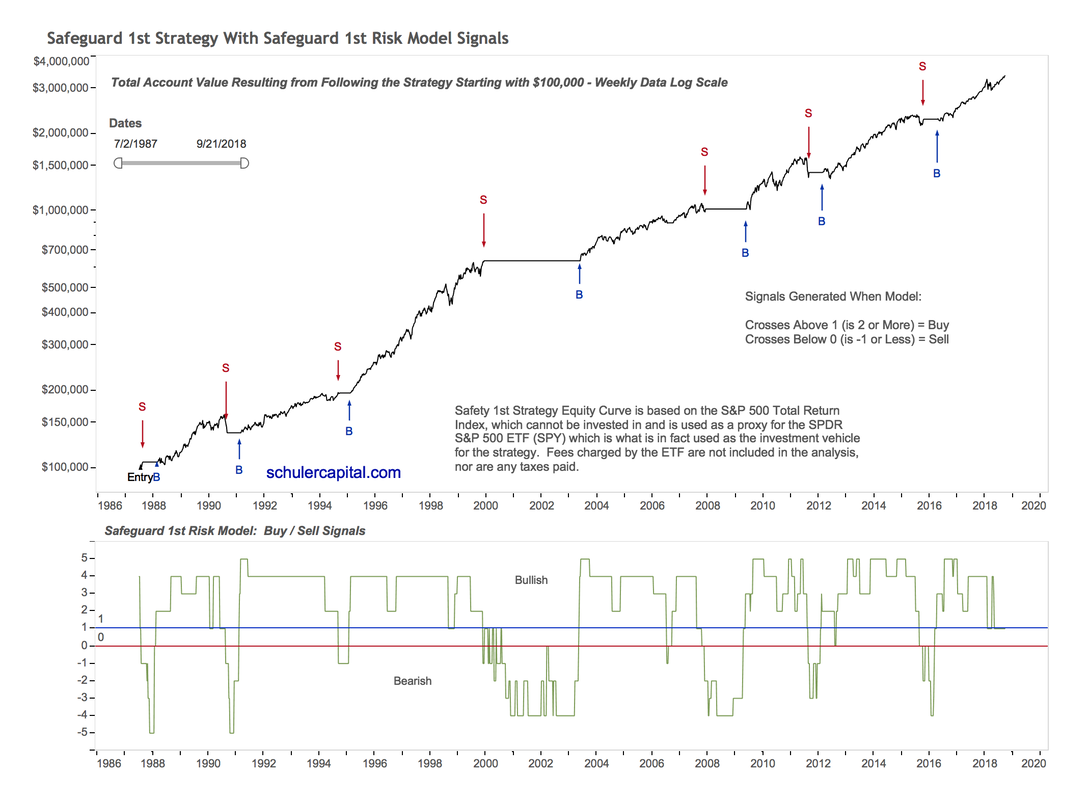
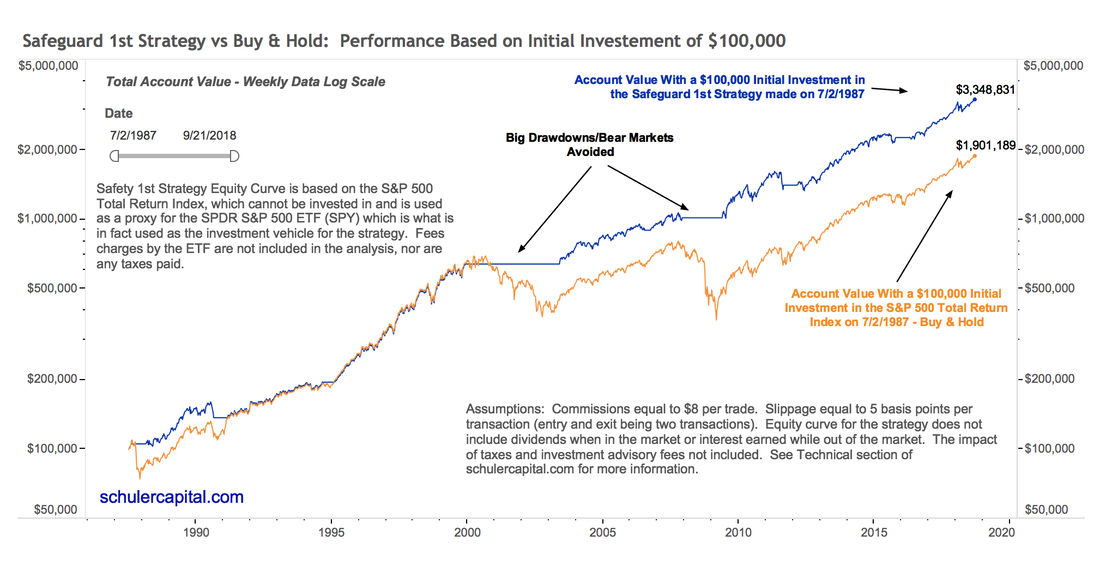
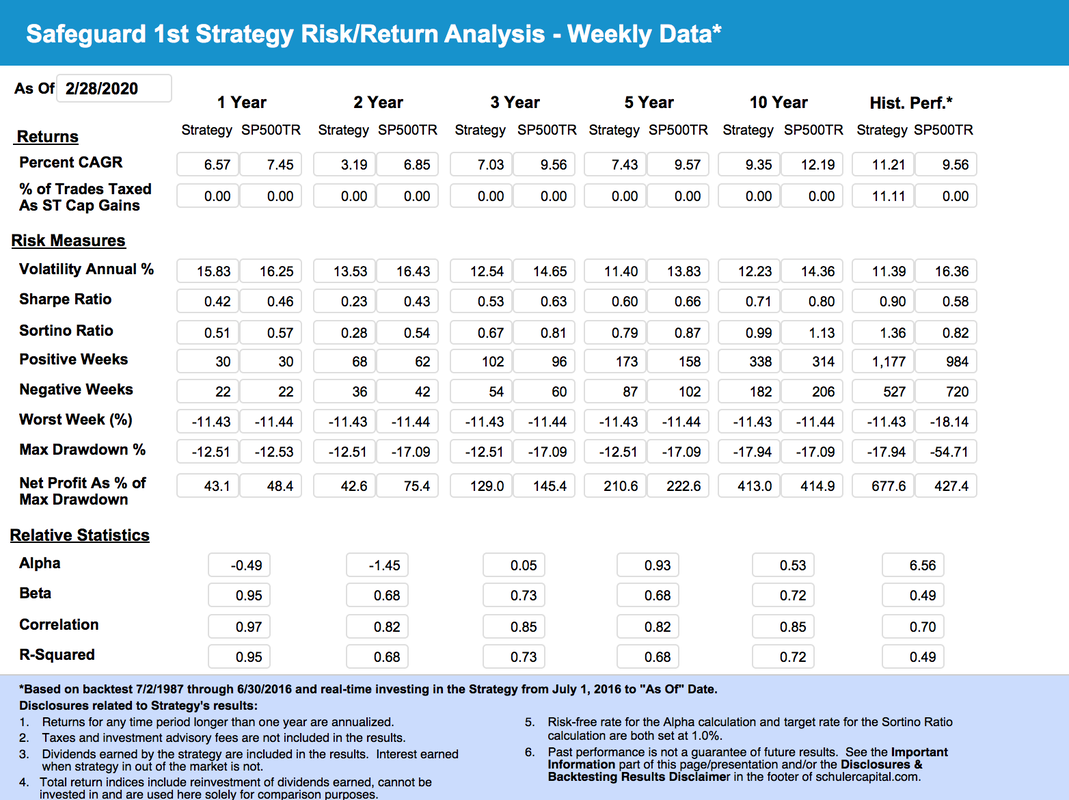
Our Safeguard 1st Strategy uses the Safeguard 1st Risk Model as its foundation for when to be in the market and when to be out of the market. The strategy's focus is on not losing money, rather than maximizing gains.
Note: More information about our charts and tables can be found at Using Our Charts/Tables. Details about the backtesting we performed can be found at Backtesting Methodology & Results. Definitions for many technical terms can be found in Definitions. Click on charts/tables to enlarge. |
|
|
|
|
|